Friday, May 31, 2019
Summer Smackdown: Which Home Is Your Favorite?
 Hi, I'm Parker Stiles. I'm the owner of Barrington Acquisitions, a real estate investment company operating in Charleston, SC and Atlanta, GA.
We help homeowners sell their home fast.
Hi, I'm Parker Stiles. I'm the owner of Barrington Acquisitions, a real estate investment company operating in Charleston, SC and Atlanta, GA.
We help homeowners sell their home fast.
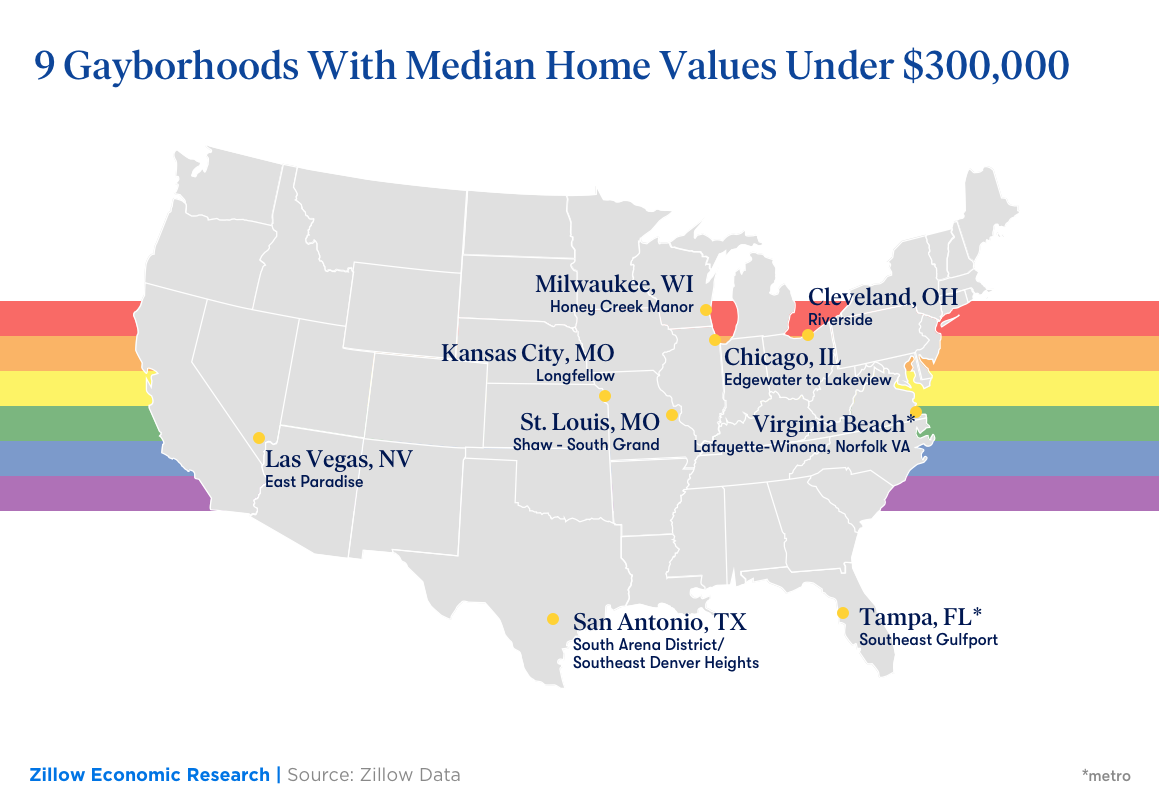
9 Gayborhoods With Median Home Values Under $300,000
Back when people were declaring the death of American cities, LGBTQ+ residents in search of affordable housing gravitated to urban areas, and eventually created gayborhoods - cultural enclaves of community and belonging. Forty years later, some of those gayborhoods are among the most sought-after neighborhoods in the country.
That cycle of urban gentrification, which began in the 1970s, continues today as people are drawn to amenities in gayborhoods and their proximity to urban job centers. While that translates into a home value premium in most gayborhoods[1], some offer a steep discount.
Take the South Arena District/Southeast Denver Heights section of San Antonio, where 4% of households are headed by same-sex couples. A typical home there costs 36.9% less than the city at large ($111,500 versus $176,800).
The premiums carried by most gayborhoods ironically puts those areas out of reach for many LGBTQ+ people, especially women and people who are transgender and gender nonconforming. Those groups, on average, have lower incomes than cisgender gay men.
Among the priciest gayborhoods is West Palm Springs, Calif., where 9% of all homes are headed by same-sex couples. A typical home there costs about $1.2 million - $860,300 more than a typical home in the Riverside metro area, which costs $369,200. That amounts to a 233% surcharge, and it’s not even the highest. Zillow ran a full analysis of price premiums in gayborhoods around the country.
Rather than feature gayborhoods with home values below the surrounding city - which includes downtown San Jose, Calif., where the typical home costs 38.1% less than the surrounding city, but is still $553,900 - instead, we’re highlighting nine gayborhoods nationwide where homes are valued under $300,000:
| Housing Market (by city unless specified) | Gayborhood | % Same-Sex Couples | Gayborhood Home Value | Market Home Value | Gayborhood Premium |
| San Antonio | South Arena District/Southeast Denver Heights | 4.0% | $111,500 | $176,800 | -36.9% |
| Milwaukee | Honey Creek Manor | 2.3% | $146,200 | $123,200 | 18.7% |
| Las Vegas | East Paradise | 4.9% | $217,510 | $276,500 | -21.3% |
| Cleveland | Riverside | 3.1% | $221,000 | $56,100 | 293.9% |
| Virginia Beach Metro | Lafayette-Winona, Norfolk VA | 2.7% | $224,200 | $230,200 | -2.6% |
| Tampa-St. Petersburg Metro | Southeast Gulfport (small city outside of St. Petersburg) | 7.6% | $236,700 | $214,300 | 10.5% |
| St. Louis | Shaw – South Grand | 3.8% | $238,126 | $119,500 | 99.3% |
| Kansas City | Longfellow | 5.7% | $251,300 | $394,735 | -36.3% |
| Chicago | Edgewater to Lakeview | 3.7% | $299,506 | $230,400 | 30.0% |
Methodology
- To produce the table of gayborhoods, this research mapped concentrations of same-sex couple households and Zillow Home Value Index by census tract. The percentage of same-sex couples in each tract were gathered from the American Community Survey 2013-2017 dataset made accessible by IPUMS.org. Census tracts and groupings with the highest percentages of same-sex couple households were matched to the neighborhood that best contained them. Tracts with a very small number of households were not included in the analysis.
- The concentration of couples in more affordable neighborhoods with fewer gay bars and amenities illustrate a possible shortcoming of Census's same-sex couple data: It is likely to overrepresent older LGBTQ households who are more likely to be displaced to more affordable areas and out of amenity-rich spaces.[2]
- The lack of a question in the American Community Survey on sexual orientation and gender identity means that single LGBTQ people cannot be identified. As many of the above metros show, this can lead to gayborhoods that are likely to have high concentrations of LGBTQ singles being invisible on the map-often moving gayborhoods to more affordable and suburban parts of major metros.
[1] High percentages of same-sex couple households are unlikely to cause high home price premiums. Instead, because they are often located in or near urban cores, their proximity to work centers and amenities is likely to be more associated with the premiums.
[2] Using same-sex couple households, which is the measurement made available by the U.S. Census Bureau, is a workaround to the absense of a question about sexual orientation and gender identity. Same-sex couple households omit singles and generally skew towards older LGBTQ populations.
The post 9 Gayborhoods With Median Home Values Under $300,000 appeared first on Zillow Research.
via 9 Gayborhoods With Median Home Values Under $300,000
Hi, I'm Parker Stiles. I'm the owner of Barrington Acquisitions, a real estate investment company operating in Charleston, SC and Atlanta, GA.
We help homeowners sell their home fast.
Fantasy Island! Private Island in Florida Keys Is This Week’s Most Popular Home
Hi, I'm Parker Stiles. I'm the owner of Barrington Acquisitions, a real estate investment company operating in Charleston, SC and Atlanta, GA.
We help homeowners sell their home fast.
Thursday, May 30, 2019
$49M Estate Once Owned by Jennifer Aniston and Brad Pitt Is Most Expensive New Listing
Hi, I'm Parker Stiles. I'm the owner of Barrington Acquisitions, a real estate investment company operating in Charleston, SC and Atlanta, GA.
We help homeowners sell their home fast.
Prince Harry and Meghan’s New Home Has a Huge Problem Archie Can’t Miss
Hi, I'm Parker Stiles. I'm the owner of Barrington Acquisitions, a real estate investment company operating in Charleston, SC and Atlanta, GA.
We help homeowners sell their home fast.
Wednesday, May 29, 2019
Trying to Improve Your Credit Scores With Retail Store Cards Is Probably a Bad Idea
It may not be worth it.
The post Trying to Improve Your Credit Scores With Retail Store Cards Is Probably a Bad Idea appeared first on RE: Find.
from Trying to Improve Your Credit Scores With Retail Store Cards Is Probably a Bad Ideahttps://http://bit.ly/2KbmI77
Hi, I'm Parker Stiles. I'm the owner of Barrington Acquisitions, a real estate investment company operating in Charleston, SC and Atlanta, GA.
We help homeowners sell their home fast.
Amazon May Be Expanding in NYC After All: What That Means for Real Estate
Hi, I'm Parker Stiles. I'm the owner of Barrington Acquisitions, a real estate investment company operating in Charleston, SC and Atlanta, GA.
We help homeowners sell their home fast.
Most popular homes and their neighborhoods of May 2019
Hi, I'm Parker Stiles. I'm the owner of Barrington Acquisitions, a real estate investment company operating in Charleston, SC and Atlanta, GA.
We help homeowners sell their home fast.
Unexpected Repairs and Maintenance Top the List of Regrets for Homeowners
The large majority of homeowners don't envy their renter peers: Only 8% of homeowners wish they were renting instead, according to the Zillow Housing Aspirations Report[1]
Still, homeowners do have some regrets – most notably the curse of unexpected repairs: 36% of homeowners wish they didn’t have to deal with unexpected repairs and maintenance. The next-biggest regret is the inability to relocate (27%), followed by the bane of too much yardwork (25%).
Almost three in four homeowners (72%) have at least one regret about their home, though rarely that it's too big. Despite the tiny home craze and a trend toward downsizing, only 11% of homeowners think their house is too large.
Age plays a role, with 81% of younger homeowners (age 18 to 34) registering at least one regret, compared to 65% of homeowners older than 54. The biggest difference in regrets between those age groups is financial: 30% say their mortgage payment is too high, compared to 12% of older homeowners.
Younger homeowners also are more than twice as likely as their older counterparts to say they regret rushing the process of buying a home: 29% compared to 12%.
Children up the ante: More homeowners with children have housing regrets (79%) compared to homeowners who are child free (69%) – but both groups are more satisfied than renters with each of those family make-ups.
In fact, renters[2] in general have more regrets. The biggest: 52% of renters wish they were building equity in their own home, equal to the share that said they wish they could customize their home to suit their needs.
[1] A semiannual survey conducted by Ipsos of 10,000 homeowners and renters in 20 of the country's largest metro areas.
[2] Renters refer to those who rent their home or live with family members or in another living situation, but do not own their home.
The post Unexpected Repairs and Maintenance Top the List of Regrets for Homeowners appeared first on Zillow Research.
via Unexpected Repairs and Maintenance Top the List of Regrets for Homeowners
Hi, I'm Parker Stiles. I'm the owner of Barrington Acquisitions, a real estate investment company operating in Charleston, SC and Atlanta, GA.
We help homeowners sell their home fast.
45% of Renters Wish They Owned
For all the headaches of homeownership, renters are the ones with more regrets, according to the Zillow Housing Aspirations Report.[1] One of their biggest: renting. In fact 45% of renters[2] said they regret renting rather than buying - more than five times the share of homeowners (8%) who regret buying instead of renting.
Half wish the rent weren't so high
Tenants' top regrets are not being able to build equity and not being able to customize or improve their rentals (52% in each case), followed closely by wishing the rent weren't so high (50%).
Renters also found their homes were too small (40%, compared to 21% of homeowners) and that they lack private outdoor space (49%, compared to 25% of homeowners regretting all that yardwork).
Across major metros, 87% of renters have at least one regret about their home, compared to 72% of homeowners. The metro with the largest share of renters reporting at least one regret is Phoenix (93%), followed by San Francisco (92%) and Denver, San Diego and San Jose, Calif. (all at 91%).
Like homeowners, renters become less regretful with age: 90% of renters ages 18 to 34 have at least one regret about their rental, compared to 82% of renters age 55 and up.
Pets and parking mark the biggest differences in regrets between those age groups: 38% of younger renters say pet ownership is too limited, compared to 21% of older renters. Similarly, 40% of younger renters say there's not enough parking, compared to 25% of older renters.
Having children at home also makes a big difference. Renters with children are more likely to have at least one regret about their home: 93% versus 86% of renters without children.
They're also more likely to regret renting instead of buying: 59% compared to 42% of renters without children.
[1] A semiannual survey conducted by Ipsos of 10,000 homeowners and renters in 20 of the country's largest metro areas.
[2] Renters refer to those who rent their home or live with family members or in another living situation, but do not own their home.
The post 45% of Renters Wish They Owned appeared first on Zillow Research.
via 45% of Renters Wish They Owned
Hi, I'm Parker Stiles. I'm the owner of Barrington Acquisitions, a real estate investment company operating in Charleston, SC and Atlanta, GA.
We help homeowners sell their home fast.
Tuesday, May 28, 2019
March Case-Shiller Results and April Forecast: Home Buyers Hitting a Breaking Point?
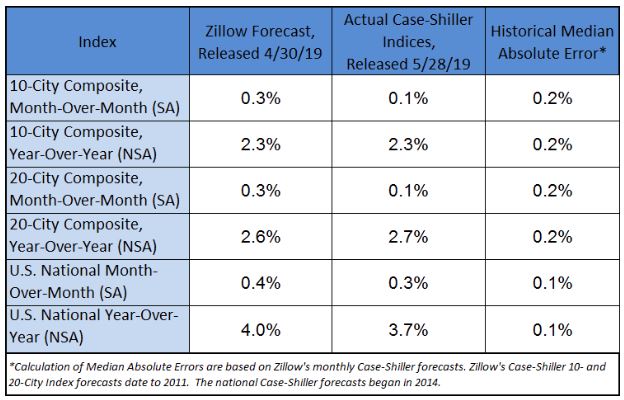
- Home prices rose 3.7% year-over-year in March, down from February's annual gain of 3.9%.
- Case-Shiller's 10-City Composite rose 2.3% year-over-year in March, down from a 2.5% annual gain in February. The 20-City Composite climbed 2.7% from last March, down from 3% growth in February.
- Las Vegas, Phoenix and Tampa reported the highest year-over-year gains among the 20 cities.
Home buyers have hit a breaking point in what they're willing to pay, even with low mortgage rates and even in places where incomes are high - and home price growth is slowing in response. U.S. home prices rose 3.7% in March from a year earlier, according to the S&P Case-Shiller home price indices, a touch slower than February's 3.9% annual growth.
Pricey West Coast markets are the slowest growers on Case-Shiller's 20-City Composite Index. Home prices in Los Angeles and San Diego rose the slowest, each up 1.3% from last March. They were followed by San Francisco, up 1.4%, and Seattle, up 1.6%.
Meanwhile, Las Vegas Phoenix and Tampa reported the highest year-over-year gains among the 20 cities in March, at 8.2%, 6.1% and 5.3%, respectively. Only four of those 20 cities reported higher annual price increases in March than in February, confirming the widespread slowdown in price gains.
As home price growth cools, sellers are having to make price cuts more often than before, despite continued restraints on inventory. While slower growing prices are a boon to buyers, particularly those entering the market for the first time, prices are still climbing. Affordability remains a concern and may be keeping many would-be buyers from entering the market.
It also limits the meaningful uptick in home sales volumes that low mortgage rates might typically generate.
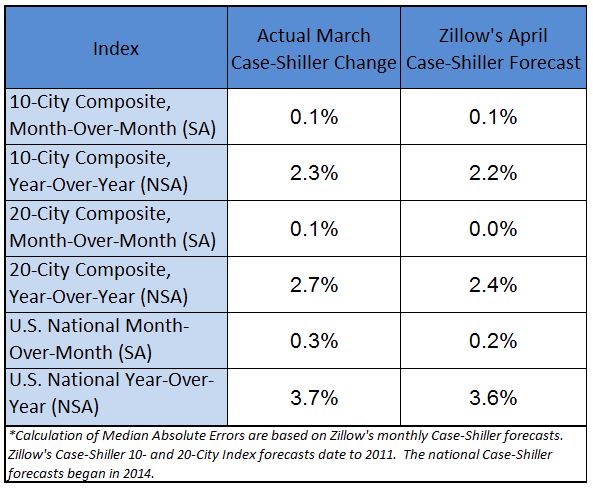
Looking ahead, Zillow’s April Case-Shiller forecast is for continued modest slowdowns in annual home price growth across all three major indices. Annual U.S. home price growth is expected to fall to 3.6%.
The post March Case-Shiller Results and April Forecast: Home Buyers Hitting a Breaking Point? appeared first on Zillow Research.
via March Case-Shiller Results and April Forecast: Home Buyers Hitting a Breaking Point?
Hi, I'm Parker Stiles. I'm the owner of Barrington Acquisitions, a real estate investment company operating in Charleston, SC and Atlanta, GA.
We help homeowners sell their home fast.
Uber Drivers Seek Extra Cash Working for House Flippers
Hi, I'm Parker Stiles. I'm the owner of Barrington Acquisitions, a real estate investment company operating in Charleston, SC and Atlanta, GA.
We help homeowners sell their home fast.
Monday, May 27, 2019
Charging Rent When Your Adult Kid Moves Home
Hi, I'm Parker Stiles. I'm the owner of Barrington Acquisitions, a real estate investment company operating in Charleston, SC and Atlanta, GA.
We help homeowners sell their home fast.
7 Luxurious Outdoor Kitchens Ready for Summertime Eats
Hi, I'm Parker Stiles. I'm the owner of Barrington Acquisitions, a real estate investment company operating in Charleston, SC and Atlanta, GA.
We help homeowners sell their home fast.
Friday, May 24, 2019
Rocky Mountain High: Colorful Colorado Classic Is Week’s Most Popular Home
Hi, I'm Parker Stiles. I'm the owner of Barrington Acquisitions, a real estate investment company operating in Charleston, SC and Atlanta, GA.
We help homeowners sell their home fast.
Thursday, May 23, 2019
‘Architecturally Significant’ $55M Palisades Mansion Is Most Expensive New Listing
Hi, I'm Parker Stiles. I'm the owner of Barrington Acquisitions, a real estate investment company operating in Charleston, SC and Atlanta, GA.
We help homeowners sell their home fast.
The Amazon Effect: Prices Up, Listings Down Near Its New HQ2 in Virginia
Hi, I'm Parker Stiles. I'm the owner of Barrington Acquisitions, a real estate investment company operating in Charleston, SC and Atlanta, GA.
We help homeowners sell their home fast.
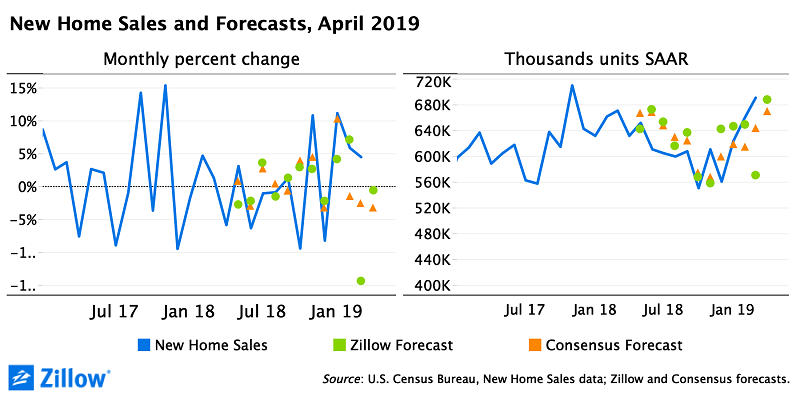
April New Home Sales: Better Than They Seem
While the headline figures are disappointing, this decline in new home sales does not reflect the overall health of the housing market. The strong reading from March greatly exceeded expectations and was revised upward today; without that revision, April’s month-over-month decline would be just 2.7%–and the underlying trend in sales remains strong. Builders are finding ways to deliver homes despite expensive land and labor prices, a boon to buyers thirsty for more supply. Strong builder confidence was borne out by last week’s encouraging home starts figures, which suggest that the supply of new homes is poised for growth. This strength, combined with enduring low mortgage rates and a historically strong job market suggest that today's reading is just a slight step back in the continued recovery of new home sales.
The post April New Home Sales: Better Than They Seem appeared first on Zillow Research.
via April New Home Sales: Better Than They Seem
Hi, I'm Parker Stiles. I'm the owner of Barrington Acquisitions, a real estate investment company operating in Charleston, SC and Atlanta, GA.
We help homeowners sell their home fast.
Gayborhood Home Premiums Top 200% in Some Markets
Gayborhoods-cultural enclaves that have long provided safety, community and belonging for LGBTQ+ people-are so in-demand that, in dozens of markets across the country, you'd pay a hefty premium to live there.
We're talking big money; in some cases, hundreds of thousands of dollars.
Take West Palm Springs, Calif., where more than 9% of all homes are headed by same-sex couples. A typical home there costs $1.2 million-$860,300 more than a typical home in the Riverside metro area, which costs $369,200.
That 233% premium for a typical home in West Palm Springs isn't even the largest. A Midwest gayborhood in Cleveland, also coincidentally named Riverside, carries a surcharge of nearly 294%, the largest premium among 40 metros included in Zillow's analysis.
There are, of course, a few gayborhoods where homes are cheaper than the areas where they are located. For instance, a typical home in downtown San Jose, Calif. (the closest that area has to a gayborhood-with 1.1% of households headed by a same-sex couple), costs $341,300 (38%) less than the $895,200 price tag on a typical home citywide.
But, overwhelmingly, homes in gayborhoods come at a premium.[1] Ironically, that surcharge puts the neighborhoods out of reach for many LGBTQ+ people, especially women and people who are transgender and gender nonconforming. Those groups, on average, have lower incomes than cisgender gay men.
The reasons for the surcharge are many, and stem largely from the role the LGBTQ+ community has played in the gentrification of once-decaying urban centers.
During much of the 1970s and 1980s, people left cities in droves for outlying suburbs, driving down property values in urban centers. Disadvantaged populations, including LGBTQ+ people, moved in for the cheaper rents and a sense of community, becoming what sociologist Sharon Zukin describes as gentrification's vanguard. They started new businesses and created thriving and tolerant neighborhoods that attracted more affluent LGBTQ+ people, who in turn helped the communities prosper further.
The amenities and jobs near and in those urban centers made gayborhoods especially attractive places to live,[1] beginning in the 1990s. "Home prices in historically gay neighborhoods have steadily outperformed average prices for the metros in which they're located" for several decades, according to the 2015 New York Times bestseller "Zillow Talk: The New Rules of Real Estate."
That cycle of urban revival or gentrification is evident in what is now the San Francisco metro area's most expensive gayborhood, The Castro District, where more than 8% of households are headed by a same-sex couple.
In the '70s, The Castro was 8.1% less expensive than the city on average. By 2000, real estate prices in The Castro were nearly 40% above the average for the San Francisco metro.
Today, a typical home in the southwest corner of The Castro by Mount Olympus-where nearly 14% of households are same-sex couples, the highest among the analyzed U.S. metros-costs $1.8 million. That's more than 30% higher than the $1.35 million price tag on a typical home in San Francisco at large.
Zillow calculated the premiums associated with each major market's gayborhood by mapping same-sex couple households by census tract, matching those tracts to neighborhoods, and comparing typical home values between those neighborhoods and each city/metro as a whole.
Here's a snapshot of some of the premiums associated with some of the nation's most expensive gayborhoods:
Los Angeles
L.A. is a rare case, in that the city limits don't include nearby West Hollywood, which has the highest concentration of same-sex couple households in the metro area (4.75%). A typical home in West Hollywood is valued at $203,600 (33%) more than one in L.A. county.
The west side of the Norma Triangle neighborhood in West Hollywood, where 11.2% of households are same-sex couples, has a $468,000 (76%) premium compared to L.A. county.
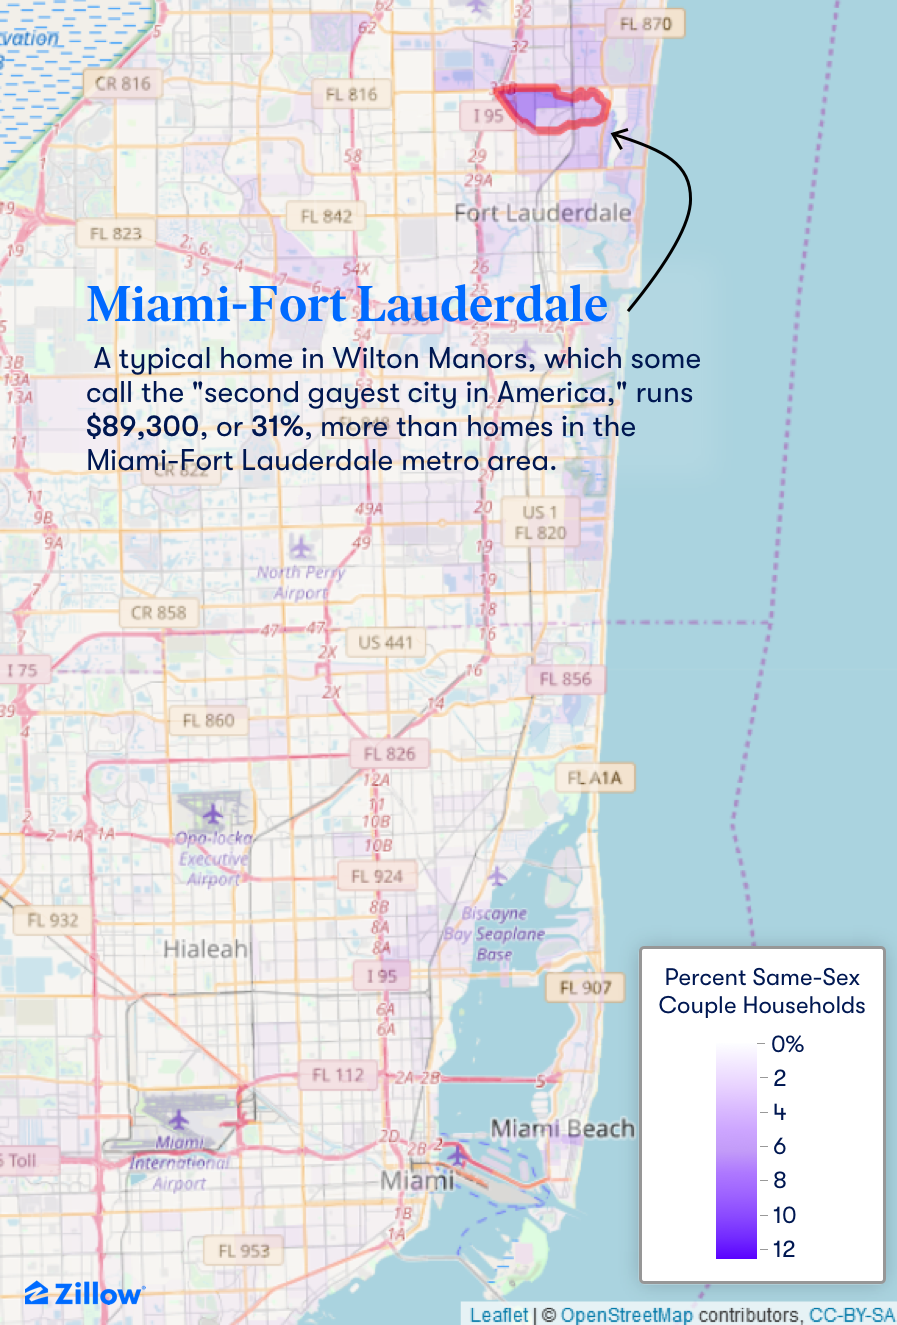
Miami-Fort Lauderdale
Nearly 13% of households are same-sex couples in the western edge of Wilton Manors, a city north of Fort Lauderdale that boasts of being "The Second Gayest City in America."
A typical home in Wilton Manors will run you $89,300 (31%) more than if you'd bought one in the Miami-Fort Lauderdale metro area, where the typical home costs $284,900.
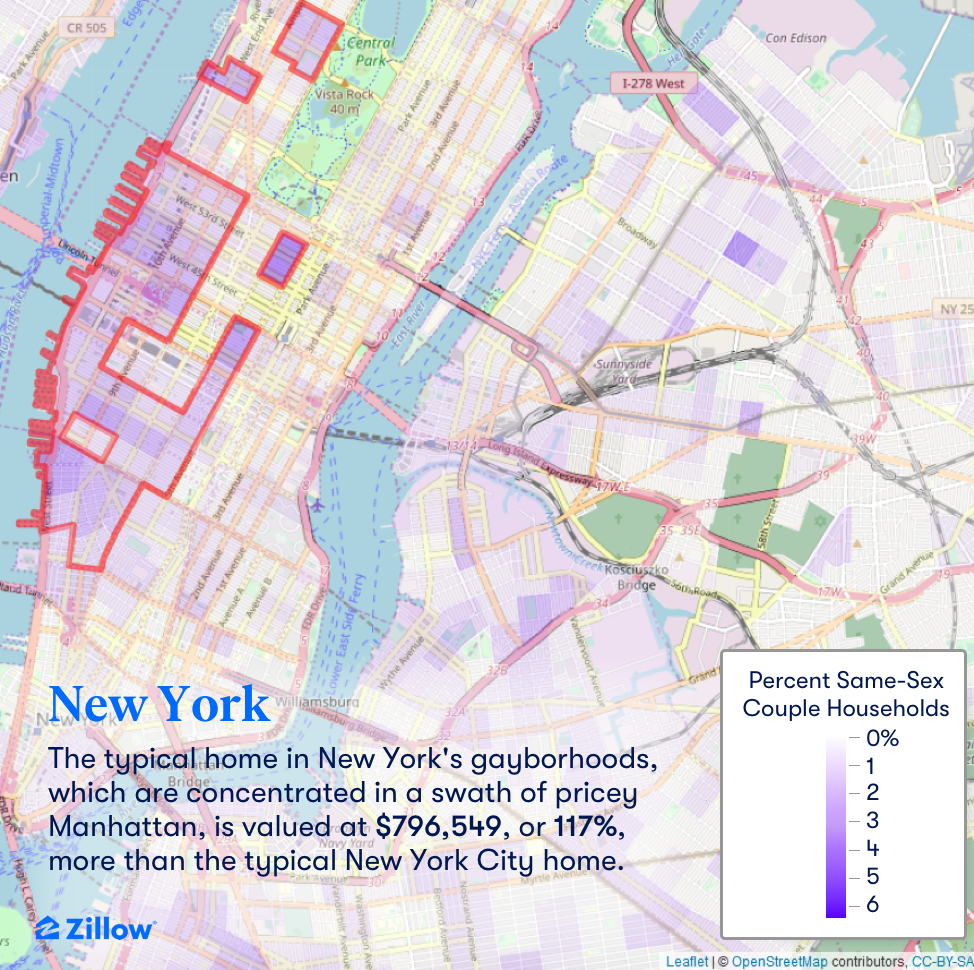
New York
Gayborhoods in New York are dotted throughout the city and metro area, but the highest concentrations of same-sex couple households are located throughout Midtown, the Garment District, and the West Side of Manhattan from West 74th Street to Christopher Street, including the Upper West Side, Chelsea, Hell's Kitchen and the West Village (outlined in red on the map below).
The typical home in this broad swath of Manhattan with higher concentrations of same-sex couple households is valued at $249,900 (20%) more than the typical Manhattan home, and $796,549 (117%) more than one in New York City as a whole.
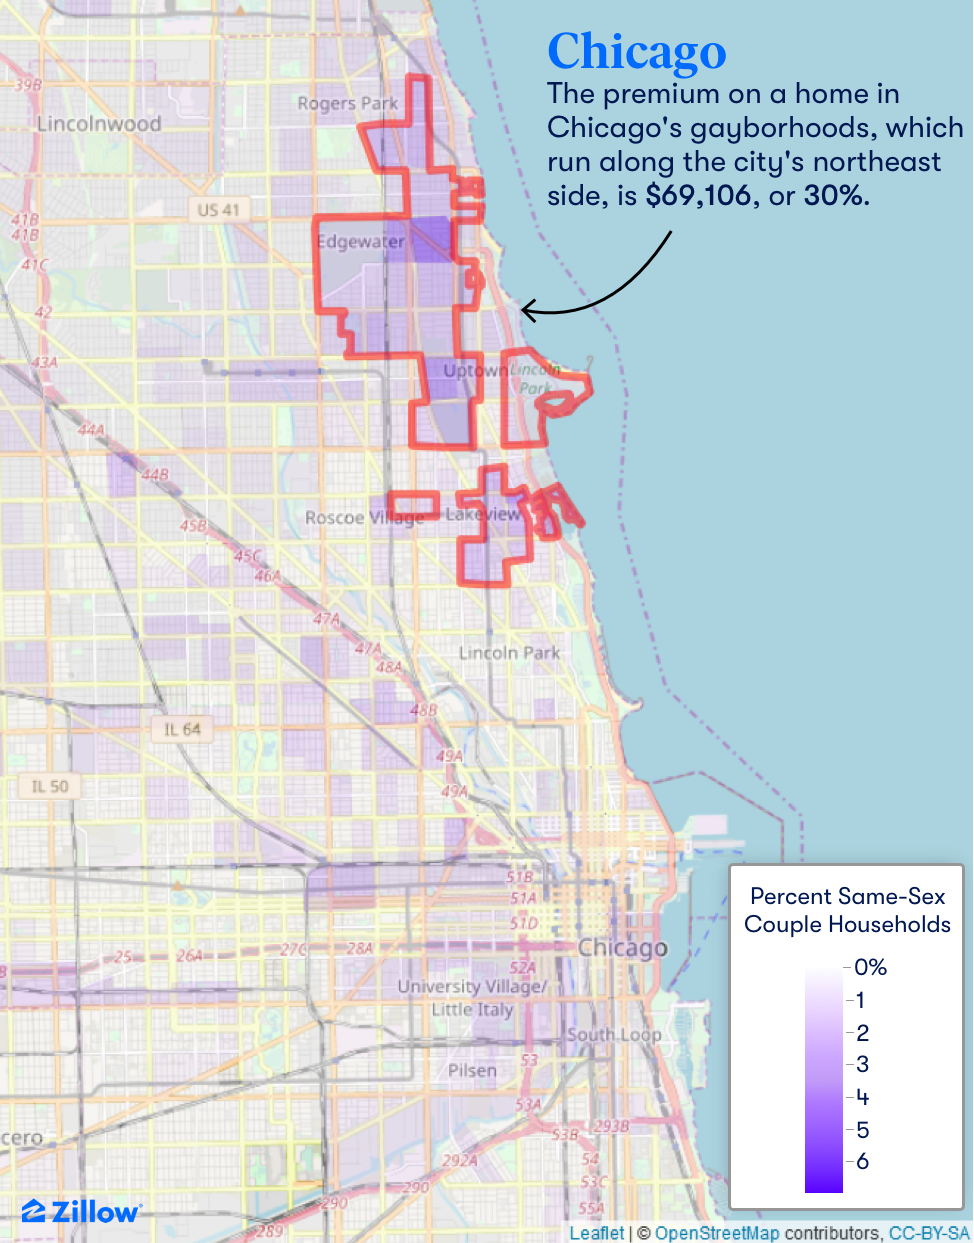
Chicago
The higher concentrations of Chicago's same-sex couple households run along the northeastern side of the city in the communities of Edgewater, Uptown, Boystown and Lakeview (outlined in red below). The median home premium on this block of neighborhoods, compared to the city as a whole, is $69,106 (30%).
Seattle
Capitol Hill is Seattle's historic gayborhood, but the Central District, concentrated around Minor and Yesler, has a higher percentage of same-sex couple households. A Seattle Times analysis in 2014 found that while most other Seattle neighborhoods saw an increase in same-sex couple households between 2000 and 2012, Capitol Hill, which has a large number of LGBTQ+ establishments, saw a 23% drop.
The premium for a home in the Central District (outlined in red below) is only $3,411 (0.5%) compared to the city as a whole, likely in part because many same-sex couples relocated to the neighborhood and out of Capitol Hill as prices there, and in the city as a whole, skyrocketed in the past decade.

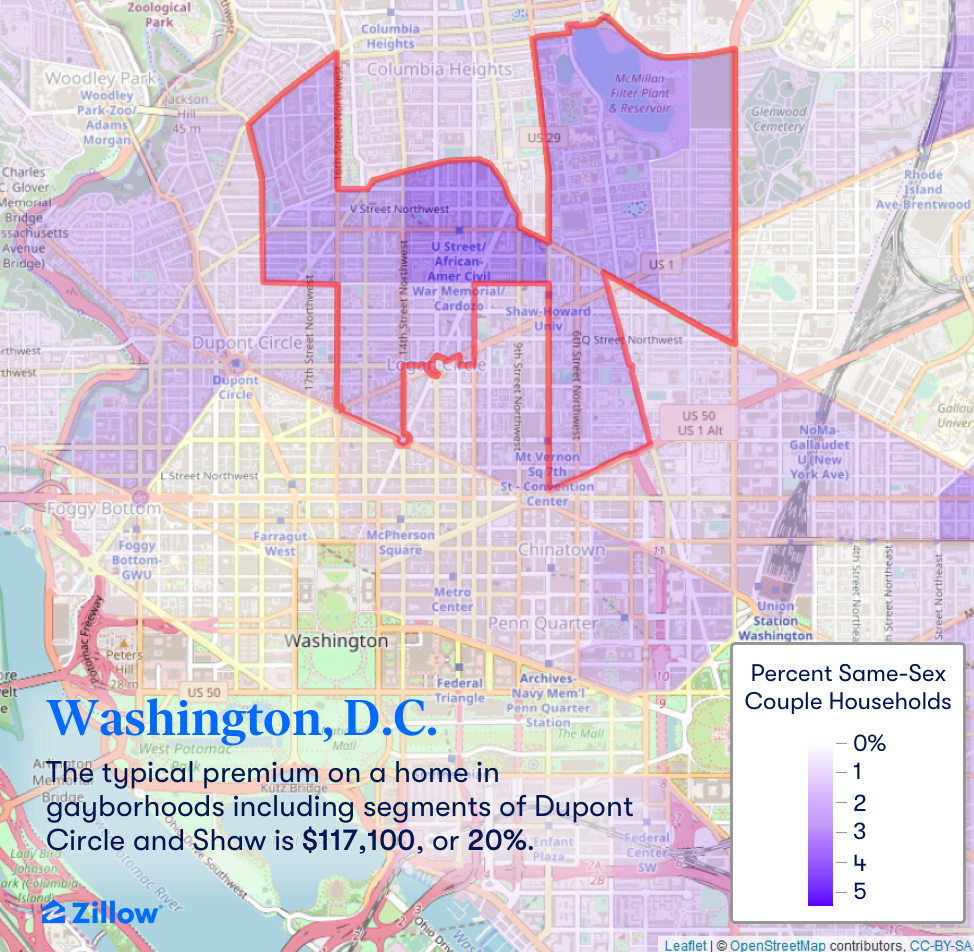
Washington, D.C.
While same-sex couple households are spread throughout the D.C. area, they are especially concentrated near Logan Circle. Segments of Dupont Circle, Shaw and Ledroit Park (outlined in red below) all have higher percentages of same-sex couple households than the District as a whole.
The typical premium on a home in those areas: $117,100, or 20%.
Atlanta
Midtown holds the title of Atlanta's gayborhood, and has a solid representation of gay bars. The typical home there costs $44,500 (17%) more than the typical Atlanta home.
| Housing Market (by city unless specified) | Gayborhood | % Same-Sex Couples | Gayborhood Home Value | Market Home Value | Gayborhood Premium |
|---|---|---|---|---|---|
| New York | West South-Central Manhattan (Upper West Side to West Village) | 3.43% | $1,478,149 | $681,600 | 116.9% |
| Los Angeles County | West Hollywood | 4.75% | $822,200 | $618,600 | 32.9% |
| Chicago | Edgewater to Lakeview | 3.70% | $299,506 | $230,400 | 30.0% |
| Dallas | Oak Lawn | 2.29% | $322,900 | $217,000 | 48.8% |
| Philadelphia | Area Surrounding Lombard-South Station | 3.47% | $550,048 | $160,900 | 241.9% |
| Houston | Neartown – Montrose | 2.90% | $514,000 | $187,800 | 173.7% |
| Washington, D.C. | Logan Circle and Surrounding Areas | 3.97% | $697,200 | $580,100 | 20.2% |
| Miami-Fort Lauderdale Metro | Wilton Manors | 8.82% | $374,200 | $284,900 | 31.3% |
| Atlanta | Midtown | 2.95% | $305,700 | $261,200 | 17.0% |
| Boston | Meeting House Hill | 7.92% | $640,600 | $603,600 | 6.1% |
| San Francisco | Castro | 8.64% | $1,767,128 | $1,353,500 | 30.6% |
| Detroit Metro | Pleasant Ridge | 5.58% | $330,100 | $162,200 | 103.5% |
| Riverside Metro | West Palm Springs | 9.21% | $1,229,500 | $369,200 | 233.0% |
| Phoenix | South Central Encanto | 6.37% | $442,400 | $242,600 | 82.4% |
| Seattle | Central District (Minor, Madison Valley, Leschi) | 2.98% | $729,911 | $726,500 | 0.5% |
| Minneapolis | Bryn Mawr | 7.59% | $406,000 | $267,900 | 51.5% |
| San Diego | North Banker’s Hill | 10.08% | $792,400 | $632,600 | 25.3% |
| St. Louis | Shaw – South Grand | 3.78% | $238,126 | $119,500 | 99.3% |
| Tampa-St. Petersburg Metro | Southeast Gulfport (small city outside of St. Petersburg) | 7.58% | $236,700 | $214,300 | 10.5% |
| Denver | Golden Triangle | 4.23% | $512,700 | $394,735 | 29.9% |
| Portland | Northwest, West of 23rd | 6.33% | $850,100 | $425,500 | 99.8% |
| Charlotte | Plaza Midwood | 4.66% | $470,800 | $225,500 | 108.8% |
| Sacramento | Northern Land Park | 2.63% | $553,900 | $327,200 | 69.3% |
| San Antonio | South Arena District/Southeast Denver Heights | 4.04% | $111,500 | $176,800 | -36.9% |
| Orlando | Audubon Park & Coytown | 5.36% | $307,200 | $241,800 | 27.0% |
| Cincinnati | Clifton | 2.05% | $306,600 | $146,400 | 109.4% |
| Cleveland | Riverside | 3.10% | $221,000 | $56,100 | 293.9% |
| Kansas City | Longfellow | 5.68% | $251,300 | $394,735 | -36.3% |
| Las Vegas | East Paradise | 4.90% | $217,510 | $276,500 | -21.3% |
| Columbus | Victorian Village | 4.75% | $375,800 | $156,200 | 140.6% |
| Indianapolis | Overlap of Broad Ripple and Meridian Kessler | 5.80% | $334,600 | $144,200 | 132.0% |
| San Jose, Calif. | Downtown | 1.12% | $553,900 | $895,200 | -38.1% |
| Austin | Galindo | 3.36% | $463,800 | $368,800 | 25.8% |
| Virginia Beach Metro | Lafayette-Winona, Norfolk VA | 2.65% | $224,200 | $230,200 | -2.6% |
| Nashville | Lockeland Springs | 3.08% | $472,700 | $266,000 | 77.7% |
| Milwaukee | Honey Creek Manor | 2.26% | $146,200 | $123,200 | 18.7% |
Methodology
- To produce the table of gayborhoods, this research mapped concentrations of same-sex couple households and Zillow Home Value Index by census tract. The percentage of same-sex couples in each tract were gathered from the American Community Survey 2013-2017 dataset made accessible by IPUMS.org. Census tracts and groupings with the highest percentages of same-sex couple households were matched to the neighborhood that best contained them. Tracts with a very small number of households were not included in the analysis.
- The concentration of couples in more affordable neighborhoods with fewer gay bars and amenities illustrate a possible shortcoming of Census's same-sex couple data: It is likely to overrepresent older LGBTQ households who are more likely to be displaced to more affordable areas and out of amenity-rich spaces.[2]
- The lack of a question in the American Community Survey on sexual orientation and gender identity means that single LGBTQ people cannot be identified. As many of the above metros show, this can lead to gayborhoods that are likely to have high concentrations of LGBTQ singles being invisible on the map-often moving gayborhoods to more affordable and suburban parts of major metros.
[1] High percentages of same-sex couple households are unlikely to cause high home price premiums. Instead, because they are often located in or near urban cores, their proximity to work centers and amenities is likely to be more associated with the premiums.
[2] Using same-sex couple households, which is the measurement made avalable by the U.S. Census Bureau, is a workaround to the absense of a question about sexual orientation and gender identity. Same-sex couple households omit singles and generally skew towards older LGBTQ populations.
The post Gayborhood Home Premiums Top 200% in Some Markets appeared first on Zillow Research.
via Gayborhood Home Premiums Top 200% in Some Markets
Hi, I'm Parker Stiles. I'm the owner of Barrington Acquisitions, a real estate investment company operating in Charleston, SC and Atlanta, GA.
We help homeowners sell their home fast.
As Tiny Homes Spread Across the Nation, They’re Getting Bigger—and Pricier
Hi, I'm Parker Stiles. I'm the owner of Barrington Acquisitions, a real estate investment company operating in Charleston, SC and Atlanta, GA.
We help homeowners sell their home fast.
Wednesday, May 22, 2019
The Retirement Community of the Future May Be More Like a WeWork
Hi, I'm Parker Stiles. I'm the owner of Barrington Acquisitions, a real estate investment company operating in Charleston, SC and Atlanta, GA.
We help homeowners sell their home fast.
Want to Live Near Prince Harry, Meghan, and Archie? Here’s Your Chance
Hi, I'm Parker Stiles. I'm the owner of Barrington Acquisitions, a real estate investment company operating in Charleston, SC and Atlanta, GA.
We help homeowners sell their home fast.
Tuesday, May 21, 2019
Famous Los Feliz Murder Mansion in L.A. for Sale—Would You Want to Live in It?
Hi, I'm Parker Stiles. I'm the owner of Barrington Acquisitions, a real estate investment company operating in Charleston, SC and Atlanta, GA.
We help homeowners sell their home fast.
April Existing Home Sales: Continuing to Flounder
- Existing home sales slid 0.4% from March to a seasonally adjusted annual rate (SAAR) of 5.19 million in April. Total sales fell 4.4% from April 2018.
- Inventory at the end of April was up 9.6% from March to 1.83 million and up 1.7% from a year ago.
- The median existing-home price in April was $267,300, up 3.6% from April 2018. It was the 86th straight month of year-over-year gains.
Despite encouraging buying conditions, existing home sales continue to flounder following a dismal fall and winter. The economy in April enjoyed a robust labor market, strong consumer sentiment and low mortgage rates-and was untouched by subsequent trade tensions with China. Yet an inventory shortage persists, with a greater share of listings reporting price cuts and in some months also sitting on the market longer, indications that the pace of this existing home sales may continue to suffer or possibly recover slowly going forward.
The post April Existing Home Sales: Continuing to Flounder appeared first on Zillow Research.
via April Existing Home Sales: Continuing to Flounder
Hi, I'm Parker Stiles. I'm the owner of Barrington Acquisitions, a real estate investment company operating in Charleston, SC and Atlanta, GA.
We help homeowners sell their home fast.
Fancy, yet Frugal: 10 Victorian Homes Under $300K You Can Buy Right Now
Hi, I'm Parker Stiles. I'm the owner of Barrington Acquisitions, a real estate investment company operating in Charleston, SC and Atlanta, GA.
We help homeowners sell their home fast.
Monday, May 20, 2019
Forecasts for Existing and New Sales Forecast (April 2019)
- Zillow expects April existing home sales to climb 4.2% from March to 5.42 million units at a seasonally adjusted annual rate (SAAR). That would be flat from April 2018.
- We estimate new home sales will rose 1.9% from March to 705,000 units (SAAR)-which would be up 11.4% from April 2018.
Recent months have been challenging for U.S. home sales, but signs of recovery in the sector are emerging. The sector is still recovering from a dismal fall and winter in which home sales stalled amid climbing mortgage rates, poor stock market performance and a government shutdown. After an encouraging report in February, existing sales took another step backward in March-but subsequent economic and housing market signals suggest that home sales are improving and prepared for more growth. April's figures should offer more evidence of that rebound.
We expect existing home sales posted a solid rebound in April, rising 4.2% from March to 5.4 million units at a seasonally adjusted annual rate (SAAR). That total is essentially the same as the April 2018 figure.
The National Association of Realtors (NAR) will report existing home sales figures on Tuesday, May 21.
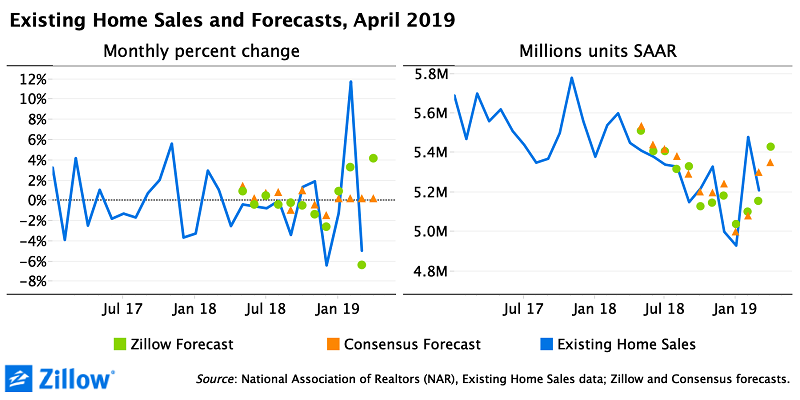
The outlook for new home sales has been more optimistic of late. Through the first three months of 2019, more new homes were sold than in the same period in 2018. Home price growth is finally slowing as builders finally build smaller, more affordable homes and price cuts become more common. The sector is not yet back to full strength, but recent history suggests an optimistic future.
We expect new home sales decreased 0.6% in April to 688,000 units (SAAR) – up 8.7% from April 2018's reading which, at the time, was a step backward from a month prior.
The U.S. Census Bureau is scheduled to report April 2019 new home sales on Thursday, May 23.
The post Forecasts for Existing and New Sales Forecast (April 2019) appeared first on Zillow Research.
via Forecasts for Existing and New Sales Forecast (April 2019)
Hi, I'm Parker Stiles. I'm the owner of Barrington Acquisitions, a real estate investment company operating in Charleston, SC and Atlanta, GA.
We help homeowners sell their home fast.
3 Common Moving Nightmares (and How to Prevent Them)
Moving may top the list of stressful experiences that can feel like a bad dream - one that can easily come true unless you take precautionary measures.
Problems can occur at every stage of the relocation process, but the most common moving nightmares fall into three categories. Here’s how they typically play out - and how to avoid them.
Bad movers
Many moving horror stories involve rogue or incompetent movers.
- The movers are late or don't show up at all. The agreed-upon time comes and goes, but you see no sign of an approaching moving truck. Regardless of the excuses you receive, the inevitable result will be lots of stress and wasted time.
- The movers are careless or inexperienced. If your movers arrive late or lack the proper equipment to handle your items safely and efficiently, your relocation can quickly turn into a nightmarish experience.
- The movers are scam artists. In the worst case scenario, you may fall victim to moving scams. Rogue movers will often request much more money than previously negotiated, based on alleged extra services. They may also hold your belongings hostage until you pay an extra "fee" as ransom or steal your more expensive belongings and discard the rest.
The good news is that there is an easy way to avoid such nightmares. All you need to do is carefully research your movers before hiring them to make sure you are dealing with licensed and experienced professionals you can trust. It’s also a good idea to purchase appropriate insurance for your belongings, just in case.
Traffic problems
Heavy traffic or road accidents can also turn your move into a real nightmare.
- Traffic jams. The moving truck is delayed, and there may not be enough time to proceed with your move as planned. You may have to postpone the relocation to another day, or you may miss your flight.
- Traffic accidents. If there has been an accident on the road, the moving truck will have to wait until the damaged vehicles are removed and normal traffic is restored. However, the scenario could get much worse: You may lose all your possessions or receive them badly damaged if the moving truck crashes, catches fire or gets trapped somewhere because of adverse weather conditions. It’s even possible that thieves could break into the vehicle and steal your goods.
- Breakdown. If the moving truck breaks down on the road, you'll have to wait for the moving company to send another vehicle. What's more, your items can easily get damaged while being transferred.
- Parking issues. The moving truck has to circle the neighborhood for hours until an appropriate parking space is vacated, or the movers have to park far away from your home’s entrance. In such cases, you'll not only lose valuable time but also have to pay an extra fee for the delay or an additional long-carry fee.
Of course, there’s nothing you can do to prevent traffic accidents or breakdowns. But you can at least reserve a parking place directly in front of your old and new homes, and choose a moving company that has experienced drivers and several moving vehicles in good condition.
Poor organization
Moving involves a lot of loose ends, and even the smallest oversight can result in a disastrous move.
- Packing chaos. You realize you’ve packed more items than previously discussed with the movers, and some items can’t be loaded onto the moving truck. Or maybe you don’t label the boxes properly. Worst of all, you may not be ready when the movers arrive. All these packing mistakes result in lost time and money.
- Furniture troubles. If your large furniture doesn't fit through the doors, you may have to leave treasured pieces behind or request hoisting services that will cost you dearly and delay your move.
- Paperwork problems. If you forget to transfer the utilities, you won't have electricity, gas and water on move-in day. If you forget to change your address, you won't have your mail delivered to your new home. If you forget to update your driver's license and car registration in time, you'll be fined. Not taking proper care of your documents will most certainly get you in trouble.
- Overspending. If you book your movers at the last moment, require too many extra services, fail to create a realistic moving budget or pack all your items without sorting them out first, you’ll end up paying much more than you expected.
- Safety issues. Make every effort to prevent injuries and accidents on moving day, as getting hurt is one of the worst things that can happen during your relocation endeavor.
The only way to avoid problems when moving house is to plan each phase of your relocation adventure in meticulous detail and stay one step ahead all the time. Otherwise, you may find yourself facing any of these all-too-common moving ordeals.
Related:
- The Hidden Costs of Moving: 11 Extra Fees to Watch For
- Picking a Moving Company: How Do Your Choices Stack Up?
- Maximizing Space in a Small Kitchen
Originally published April 15, 2016.
via 3 Common Moving Nightmares (and How to Prevent Them)
Hi, I'm Parker Stiles. I'm the owner of Barrington Acquisitions, a real estate investment company operating in Charleston, SC and Atlanta, GA.
We help homeowners sell their home fast.
3 Reasons Why Travel Insurance is Worth the Expense
Missed connections are so annoying.
The post 3 Reasons Why Travel Insurance is Worth the Expense appeared first on RE: Find.
from 3 Reasons Why Travel Insurance is Worth the Expensehttps://http://bit.ly/2HIqnWZ
Hi, I'm Parker Stiles. I'm the owner of Barrington Acquisitions, a real estate investment company operating in Charleston, SC and Atlanta, GA.
We help homeowners sell their home fast.
How to get over losing out on a home
Hi, I'm Parker Stiles. I'm the owner of Barrington Acquisitions, a real estate investment company operating in Charleston, SC and Atlanta, GA.
We help homeowners sell their home fast.
3 Best Investing Books That Every Beginner Needs to Own
Are any of these on your bookshelf?
The post 3 Best Investing Books That Every Beginner Needs to Own appeared first on RE: Find.
from 3 Best Investing Books That Every Beginner Needs to Ownhttps://http://bit.ly/2WmmwZm
Hi, I'm Parker Stiles. I'm the owner of Barrington Acquisitions, a real estate investment company operating in Charleston, SC and Atlanta, GA.
We help homeowners sell their home fast.
Three Lessons You Should Teach Your Children About Credit
Co-signing is a no-no
The post Three Lessons You Should Teach Your Children About Credit appeared first on RE: Find.
from Three Lessons You Should Teach Your Children About Credithttps://http://bit.ly/2YHvrlv
Hi, I'm Parker Stiles. I'm the owner of Barrington Acquisitions, a real estate investment company operating in Charleston, SC and Atlanta, GA.
We help homeowners sell their home fast.
The Terrible Truth About This ‘Viral’ $7K Tiny House on Amazon
Hi, I'm Parker Stiles. I'm the owner of Barrington Acquisitions, a real estate investment company operating in Charleston, SC and Atlanta, GA.
We help homeowners sell their home fast.
Falling Stars: You Won’t Believe the 10 Cities Where Home Prices Are Down the Most
Hi, I'm Parker Stiles. I'm the owner of Barrington Acquisitions, a real estate investment company operating in Charleston, SC and Atlanta, GA.
We help homeowners sell their home fast.
Friday, May 17, 2019
Porch Privacy Ideas: 5 Inexpensive DIY Projects
Ever consider a plant wall?
The post Porch Privacy Ideas: 5 Inexpensive DIY Projects appeared first on RE: Find.
from Porch Privacy Ideas: 5 Inexpensive DIY Projectshttps://http://bit.ly/2JLi5QY
Hi, I'm Parker Stiles. I'm the owner of Barrington Acquisitions, a real estate investment company operating in Charleston, SC and Atlanta, GA.
We help homeowners sell their home fast.
5 ways to become a neighborhood expert
Hi, I'm Parker Stiles. I'm the owner of Barrington Acquisitions, a real estate investment company operating in Charleston, SC and Atlanta, GA.
We help homeowners sell their home fast.
Millennial Home Buyers Might Never Come Knocking
Hi, I'm Parker Stiles. I'm the owner of Barrington Acquisitions, a real estate investment company operating in Charleston, SC and Atlanta, GA.
We help homeowners sell their home fast.
Can You Dig It? This Week’s Most Popular Home Is a ’70s Time Capsule
Hi, I'm Parker Stiles. I'm the owner of Barrington Acquisitions, a real estate investment company operating in Charleston, SC and Atlanta, GA.
We help homeowners sell their home fast.
Thursday, May 16, 2019
Beverly Hills’ Promontory Scores a Point as the Week’s Most Expensive New Listing
Hi, I'm Parker Stiles. I'm the owner of Barrington Acquisitions, a real estate investment company operating in Charleston, SC and Atlanta, GA.
We help homeowners sell their home fast.
3 of the Best Ways to Clean Vinyl Siding
Does your home look dingy?
The post 3 of the Best Ways to Clean Vinyl Siding appeared first on RE: Find.
from 3 of the Best Ways to Clean Vinyl Sidinghttps://http://bit.ly/2HtEek1
Hi, I'm Parker Stiles. I'm the owner of Barrington Acquisitions, a real estate investment company operating in Charleston, SC and Atlanta, GA.
We help homeowners sell their home fast.
Can a Showgirl Help Sell This Home? Listing Pics You Have to See to Believe
Hi, I'm Parker Stiles. I'm the owner of Barrington Acquisitions, a real estate investment company operating in Charleston, SC and Atlanta, GA.
We help homeowners sell their home fast.
April Housing Starts: Regained Momentum
- April housing starts rose 5.7% from March and fell 2.5% from a year ago, to 1.24 million units (SAAR) according to the Census Bureau. Single-family starts climbed 6.2% from March and fell 4.3% from a year ago. Multi-family starts climbed 2.3% from March and 1.4% from a year ago.
- Housing permits rose 0.6% from March but fell 5% from a year ago, driven by multi-family permits, which rose 7.1% from March and 1.5% year-over-year.
- National housing completions dropped 1.4% from March but rose 5.5% from a year earlier.
Housing starts picked up momentum in April following setbacks the past couple months. Builders spotted a clear runway in April, coming on the heels of a March rebound in new home sales and in the midst of low mortgage rates, a robust labor market and none of the barriers presented by this winter’s partial government shutdown or early signs of a trade war with China.
There’s room in the market for more new homes, with housing inventory still low by historical standards and affordability suffering in many markets. Market affordability for builders is a different story: Their costs have risen with too few lots and workers, and material costs remain high.
The post April Housing Starts: Regained Momentum appeared first on Zillow Research.
via April Housing Starts: Regained Momentum
Hi, I'm Parker Stiles. I'm the owner of Barrington Acquisitions, a real estate investment company operating in Charleston, SC and Atlanta, GA.
We help homeowners sell their home fast.
Home Values Dip Month-Over-Month for First Time in Seven Years
- In April, the median home value fell 0.1% from March, the first time the market has posted a monthly decline in seven years.
- A more stable metric-year-over-year declines-shows U.S. home values up just 6.1% from last April. That’s below annual growth of 7.5% in April 2018.
- 16 of the largest 50 metros posted home value declines in April and have had flat or falling home values since January, raising our confidence that they indeed have reached a peak.
The median U.S. home value fell 0.1% in April from March, the first monthly decline in seven years and another signal that the housing market continues to pump the brakes after several years of torrid growth.
The national housing market has been cooling for months, with annual gains slowing to 6.1% in April, down from April 2018 annual growth of 7.5%. The median home value now stands at $226,800, still above last April’s $213,700.
Home values in all but four of the country’s largest metro areas were flat or down from March to April. San Jose, Calif., posted the largest monthly decline, down 1.4%, the area's sixth month-over-month decline in a row. April also was the second month in which San Jose’s median home value fell on an annual basis, down 2.7% to $1.19 million-still the priciest large market in the nation.
It’s important not to exaggerate the significance of month-over-month changes, which are always more volatile, following the adage that one point does not make a trend. A small percentage change in one month easily could rebound the following month, something that happens with housing data on a regular basis. That’s part of the reason market watchers prefer less-volatile quarter-over-quarter and year-over-year measures, which capture longer running trends.
Still, the data show it's likely that home values in 16 of the largest 50 metros truly have peaked: Their home values are down this month and have been flat or falling for the quarter. They are San Jose, San Francisco, Pittsburgh, Los Angeles, Seattle, San Diego, New Orleans, Boston, Miami, St. Louis, Portland, Ore., Tampa, Virginia Beach, Baltimore, Philadelphia and Houston.
Home values in five of those markets-Philadelphia, Miami, Tampa, Virginia Beach and Baltimore-never returned to heights reached prior to the Great Recession more than a decade ago.
The number of U.S. homes for sale fell 1.7% year-over-year. Ten of the largest 50 metros posted double-digit inventory declines, led by Washington, D.C., (down 31.8%), Kansas City (down 24.1%), Oklahoma City (down 17.8%) and Baltimore (down 17.3%).
In a handful of the previously mentioned metros where home values appear to have hit a recent peak and are declining, inventory is also down in the double digits: Pittsburgh, where inventory dropped 12.2% year-over-year; New Orleans, down 13.1%; St. Louis, down 10.8%; Virginia Beach 13.8%; Baltimore 17.3%; Philadelphia 11.1%. That's counterintuitive, and only time will tell what is happening in these markets.
Nationwide median rent continued to grow in April for the sixth consecutive month. The median U.S. rent rose 2.6% on an annual basis, to $1,477. Rents grew the fastest in Las Vegas (up 7.8%), Phoenix (up 6.7%) and Orlando (up 6.4%).
The post Home Values Dip Month-Over-Month for First Time in Seven Years appeared first on Zillow Research.
via Home Values Dip Month-Over-Month for First Time in Seven Years
Hi, I'm Parker Stiles. I'm the owner of Barrington Acquisitions, a real estate investment company operating in Charleston, SC and Atlanta, GA.
We help homeowners sell their home fast.
7 Luxury Homes in Winter Getaways That Are Even Better in Summer
Hi, I'm Parker Stiles. I'm the owner of Barrington Acquisitions, a real estate investment company operating in Charleston, SC and Atlanta, GA.
We help homeowners sell their home fast.
Wednesday, May 15, 2019
How to Spring Clean Your Finances
Have you abandoned new year's goals? Try again.
The post How to Spring Clean Your Finances appeared first on RE: Find.
from How to Spring Clean Your Financeshttps://http://bit.ly/2Hk8ZZQ
Hi, I'm Parker Stiles. I'm the owner of Barrington Acquisitions, a real estate investment company operating in Charleston, SC and Atlanta, GA.
We help homeowners sell their home fast.
Tuesday, May 14, 2019
Houseboats and floating homes starting at $185,000
Hi, I'm Parker Stiles. I'm the owner of Barrington Acquisitions, a real estate investment company operating in Charleston, SC and Atlanta, GA.
We help homeowners sell their home fast.
Float Away Any Summertime Blues: 7 Homes With Lavish Lazy River Pools
Hi, I'm Parker Stiles. I'm the owner of Barrington Acquisitions, a real estate investment company operating in Charleston, SC and Atlanta, GA.
We help homeowners sell their home fast.
Monday, May 13, 2019
A Florida Man May Lose His Home—Because He Didn’t Cut the Grass
Hi, I'm Parker Stiles. I'm the owner of Barrington Acquisitions, a real estate investment company operating in Charleston, SC and Atlanta, GA.
We help homeowners sell their home fast.
A $1,000 Monthly Mortgage Is Real—in These 10 Bargain Cities
Hi, I'm Parker Stiles. I'm the owner of Barrington Acquisitions, a real estate investment company operating in Charleston, SC and Atlanta, GA.
We help homeowners sell their home fast.
Friday, May 10, 2019
Can a Pregnant Lady in a Bikini Help Sell This Home?
Hi, I'm Parker Stiles. I'm the owner of Barrington Acquisitions, a real estate investment company operating in Charleston, SC and Atlanta, GA.
We help homeowners sell their home fast.
Island Homes for Sale That Offer a Slice of Heaven on Earth
Life's too short not to have an adventure!
The post Island Homes for Sale That Offer a Slice of Heaven on Earth appeared first on RE: Find.
from Island Homes for Sale That Offer a Slice of Heaven on Earthhttps://http://bit.ly/2WA9nJ1
Hi, I'm Parker Stiles. I'm the owner of Barrington Acquisitions, a real estate investment company operating in Charleston, SC and Atlanta, GA.
We help homeowners sell their home fast.
Michigan Castle Once Owned by Rock Royalty Is This Week’s Most Popular Home
Hi, I'm Parker Stiles. I'm the owner of Barrington Acquisitions, a real estate investment company operating in Charleston, SC and Atlanta, GA.
We help homeowners sell their home fast.
Thursday, May 9, 2019
Most Expensive New Listing: $36M Stone Mansion in NJ Still Seeking a Buyer
Hi, I'm Parker Stiles. I'm the owner of Barrington Acquisitions, a real estate investment company operating in Charleston, SC and Atlanta, GA.
We help homeowners sell their home fast.
A Fresh Start for Old Furniture: Tips From Top Designers on ‘Working the Room’
Hi, I'm Parker Stiles. I'm the owner of Barrington Acquisitions, a real estate investment company operating in Charleston, SC and Atlanta, GA.
We help homeowners sell their home fast.
Vacation Communities Got Slammed in the Recession—Is It Safe to Buy There Now?
Hi, I'm Parker Stiles. I'm the owner of Barrington Acquisitions, a real estate investment company operating in Charleston, SC and Atlanta, GA.
We help homeowners sell their home fast.
Wednesday, May 8, 2019
Inside Frank Lloyd Wright’s Final Home: What’s Taking It So Long to Sell?
Hi, I'm Parker Stiles. I'm the owner of Barrington Acquisitions, a real estate investment company operating in Charleston, SC and Atlanta, GA.
We help homeowners sell their home fast.
Tuesday, May 7, 2019
This Is How Much Money Folks Can Save by Shopping Around for a Mortgage (It’s Quite a Lot)
Hi, I'm Parker Stiles. I'm the owner of Barrington Acquisitions, a real estate investment company operating in Charleston, SC and Atlanta, GA.
We help homeowners sell their home fast.
The Hottest Markets of April 2019: All Fired Up Over Affordability
Hi, I'm Parker Stiles. I'm the owner of Barrington Acquisitions, a real estate investment company operating in Charleston, SC and Atlanta, GA.
We help homeowners sell their home fast.
How Long Does It Take to Buy a House?
Staying on top of things will speed things up.
The post How Long Does It Take to Buy a House? appeared first on RE: Find.
from How Long Does It Take to Buy a House?http://bit.ly/2H6bhKH
Hi, I'm Parker Stiles. I'm the owner of Barrington Acquisitions, a real estate investment company operating in Charleston, SC and Atlanta, GA.
We help homeowners sell their home fast.
Buying a Home With Resale in Mind
Don't consider 'weird' homes.
The post Buying a Home With Resale in Mind appeared first on RE: Find.
from Buying a Home With Resale in Mindhttps://http://bit.ly/2V6OGTl
Hi, I'm Parker Stiles. I'm the owner of Barrington Acquisitions, a real estate investment company operating in Charleston, SC and Atlanta, GA.
We help homeowners sell their home fast.
Spring Is for Sipping: 7 Wineries for Sale That Will Fulfill Your Fermented Fantasies
Hi, I'm Parker Stiles. I'm the owner of Barrington Acquisitions, a real estate investment company operating in Charleston, SC and Atlanta, GA.
We help homeowners sell their home fast.
14 Million Millennials Still Live With Mom
- More than 14 million young adults nationwide — or 21.9% of people ages 23 to 37 — live with their mothers, up from 12.7% in 2000.
- More millennials live with their moms in areas where rents are less affordable.
A growing share of young adults should be extra thankful for their moms this Mother's Day: They're still living with her. Nationwide, 14.3 million people between the ages of 23 and 37 live with the woman of honor, not too far off from the number of children under age five who do the same (18.3 million). And the share of young adults living with mom has grown considerably: It’s now more than a fifth (21.9%) of them, up from 12.7% in 2000.
The share of young adults unable or unwilling to flee the nest was fairly constant for the first half of the 2000s, with approximately 13% living with mom. But when the housing market went bust and the economy began to unravel into a recession, the share of young adults-at this point, the millennial generation-living in their childhood homes understandably increased as they graduated into a weak economy where jobs were difficult to obtain.
Despite a fairly robust economic recovery, young adults are increasingly living with mom instead of breaking out on their own. For many, this could be a pragmatic choice in the face of rising housing costs and deteriorating affordability over the past 15 years. Some may simply be unable to afford local housing costs; others maybe could afford those costs, but choose to live with mom instead to more easily save for a down payment, security deposit or other big expense. It's also worth noting that a small, but meaningful, share of young adults have mom (and possibly dad) living at their home, perhaps to take care of their parents as they age or to have help raising children of their own-childcare, after all, is expensive. But only 1.4% of young adults are in this situation, virtually unchanged from 1.2% in 2000.
There are a few exceptions to the national trend. In 12 of the largest 35 metropolitan markets, the most recent cohort of adults between the ages of 23 and 37 have started to break away from this trend. A smaller percentage of young adults are living with mom in Atlanta, Boston and Seattle than were a year earlier. The decline is by no means dramatic-often times just a percentage-point or two-but hints that we might start to see this trend level off.
Striking, given the robust economy
It's striking that such a large share of millennials live with their mom because the economy has rebounded since the Great Recession, and unemployment rates in general are near historic lows.
The unemployment rate for young adults living with mom in 2017 was 10.3%, down from 19.5% in 2010. For comparison, the unemployment rate for young adults not living with mom was 4.3% in 2017, down from 9.2% in 2010. The strong labor market should make it easier-at least in theory-for millennials to leave the comforts of home. Yet, the share of young adults living with mom increased 4 percentage points between 2010 and 2017.
In the few exceptional metros where young adults are starting to break away more from their childhood home, unemployment rates have really plummeted in recent years. Those twin trends demonstrate that while the economic recession and housing bust left long-lasting scars, we might see change in coming years.
More young adults live at home in places where housing- particularly rents – tends to be less affordable. For example, in Miami, Riverside, Calif., New York and Los Angeles, more than 30% of millennials lived with their moms in 2017. The median rent in these areas would have devoured upwards of 35% of the income earned by the typical household.
It's no wonder that a low- or no-rent living situation is appealing to young adults just entering the workforce or those early in their careers and eager to save some cash. And living with mom also may come with the added perk of a home-cooked meal, free hugs after a crummy day or life advice, at least every once in a while.
Maybe this Mother's Day, wherever we live, we can pamper her for all of her help throughout our lives, childhood on up.
Methodology
Zillow analyzed data from the U.S. Census Bureau, American Community Survey, 2000-2017, made available by the University of Minnesota, IPUMS-USA. We identified households in which a mother and her young adult child lived in the same household. The analysis also includes households where both parents were present, as long as the mother was. 2017 was the latest year for which data was available at the time of this analysis.
The post 14 Million Millennials Still Live With Mom appeared first on Zillow Research.
via 14 Million Millennials Still Live With Mom
Hi, I'm Parker Stiles. I'm the owner of Barrington Acquisitions, a real estate investment company operating in Charleston, SC and Atlanta, GA.
We help homeowners sell their home fast.
Monday, May 6, 2019
Quiz: Which Perfect Pool Is Cool for the Summer?
Hi, I'm Parker Stiles. I'm the owner of Barrington Acquisitions, a real estate investment company operating in Charleston, SC and Atlanta, GA.
We help homeowners sell their home fast.
Affordable neighborhoods for teachers
Hi, I'm Parker Stiles. I'm the owner of Barrington Acquisitions, a real estate investment company operating in Charleston, SC and Atlanta, GA.
We help homeowners sell their home fast.
Inside Christina Anstead’s New Home, Marriage, and Show, ‘Christina on the Coast’
Hi, I'm Parker Stiles. I'm the owner of Barrington Acquisitions, a real estate investment company operating in Charleston, SC and Atlanta, GA.
We help homeowners sell their home fast.
11 Ways to Make Meeting the Neighbors Easier (‘Cause Shyness is a Thing)
Why don't you host a party?
The post 11 Ways to Make Meeting the Neighbors Easier (‘Cause Shyness is a Thing) appeared first on RE: Find.
from 11 Ways to Make Meeting the Neighbors Easier (‘Cause Shyness is a Thing)http://bit.ly/2PNPuvi
Hi, I'm Parker Stiles. I'm the owner of Barrington Acquisitions, a real estate investment company operating in Charleston, SC and Atlanta, GA.
We help homeowners sell their home fast.
Can’t Afford Life in the Big City? We’ve Found 11 Bargains in the Burbs
Hi, I'm Parker Stiles. I'm the owner of Barrington Acquisitions, a real estate investment company operating in Charleston, SC and Atlanta, GA.
We help homeowners sell their home fast.
Friday, May 3, 2019
Wild Decor in Texas Residence Makes It This Week’s Most Popular Home
Hi, I'm Parker Stiles. I'm the owner of Barrington Acquisitions, a real estate investment company operating in Charleston, SC and Atlanta, GA.
We help homeowners sell their home fast.
Thursday, May 2, 2019
Things to Consider When You Hate Your Home’s Roofline and Want to Switch It Up
You'll need to consult a design professional for this one.
The post Things to Consider When You Hate Your Home’s Roofline and Want to Switch It Up appeared first on RE: Find.
from Things to Consider When You Hate Your Home’s Roofline and Want to Switch It Uphttps://http://bit.ly/2WmNGMa
Hi, I'm Parker Stiles. I'm the owner of Barrington Acquisitions, a real estate investment company operating in Charleston, SC and Atlanta, GA.
We help homeowners sell their home fast.
Is Experian Boost Legit?
Don't discount this!
The post Is Experian Boost Legit? appeared first on RE: Find.
from Is Experian Boost Legit?http://bit.ly/2UW0MOY
Hi, I'm Parker Stiles. I'm the owner of Barrington Acquisitions, a real estate investment company operating in Charleston, SC and Atlanta, GA.
We help homeowners sell their home fast.
$65M Equestrian Estate With a Polo Field Is the Most Expensive New Listing
Hi, I'm Parker Stiles. I'm the owner of Barrington Acquisitions, a real estate investment company operating in Charleston, SC and Atlanta, GA.
We help homeowners sell their home fast.
Here’s How a Business Credit Card Can Affect Your Credit Score, So Be Careful
It's a fine line, folks.
The post Here’s How a Business Credit Card Can Affect Your Credit Score, So Be Careful appeared first on RE: Find.
from Here’s How a Business Credit Card Can Affect Your Credit Score, So Be Carefulhttps://http://bit.ly/2GZPp4T
Hi, I'm Parker Stiles. I'm the owner of Barrington Acquisitions, a real estate investment company operating in Charleston, SC and Atlanta, GA.
We help homeowners sell their home fast.
The Hottest Rentals Are Single-Family Homes, and Boomers Are Snapping Them Up
Hi, I'm Parker Stiles. I'm the owner of Barrington Acquisitions, a real estate investment company operating in Charleston, SC and Atlanta, GA.
We help homeowners sell their home fast.
Wednesday, May 1, 2019
New Book Gathers All the Essential Knowledge First-Time Home Buyers Need
Hi, I'm Parker Stiles. I'm the owner of Barrington Acquisitions, a real estate investment company operating in Charleston, SC and Atlanta, GA.
We help homeowners sell their home fast.
Here’s How to Make a Brick Home Look So 21st Century
Even a few accessories can make a difference.
The post Here’s How to Make a Brick Home Look So 21st Century appeared first on RE: Find.
from Here’s How to Make a Brick Home Look So 21st Centuryhttps://http://bit.ly/2V8suwX
Hi, I'm Parker Stiles. I'm the owner of Barrington Acquisitions, a real estate investment company operating in Charleston, SC and Atlanta, GA.
We help homeowners sell their home fast.
Sweet farmhouses for sale now, starting at $138,500
Hi, I'm Parker Stiles. I'm the owner of Barrington Acquisitions, a real estate investment company operating in Charleston, SC and Atlanta, GA.
We help homeowners sell their home fast.