The rapid movement towards remote work arrangements in the wake of the coronavirus pandemic raises some interesting questions on the future of workers in urban centers. If workers place less value on living near a downtown job center they no longer need to go to (at least, not as often), will more of them decamp for the suburbs — potentially hollowing out urban centers that had been enjoying a renaissance over the past decade?
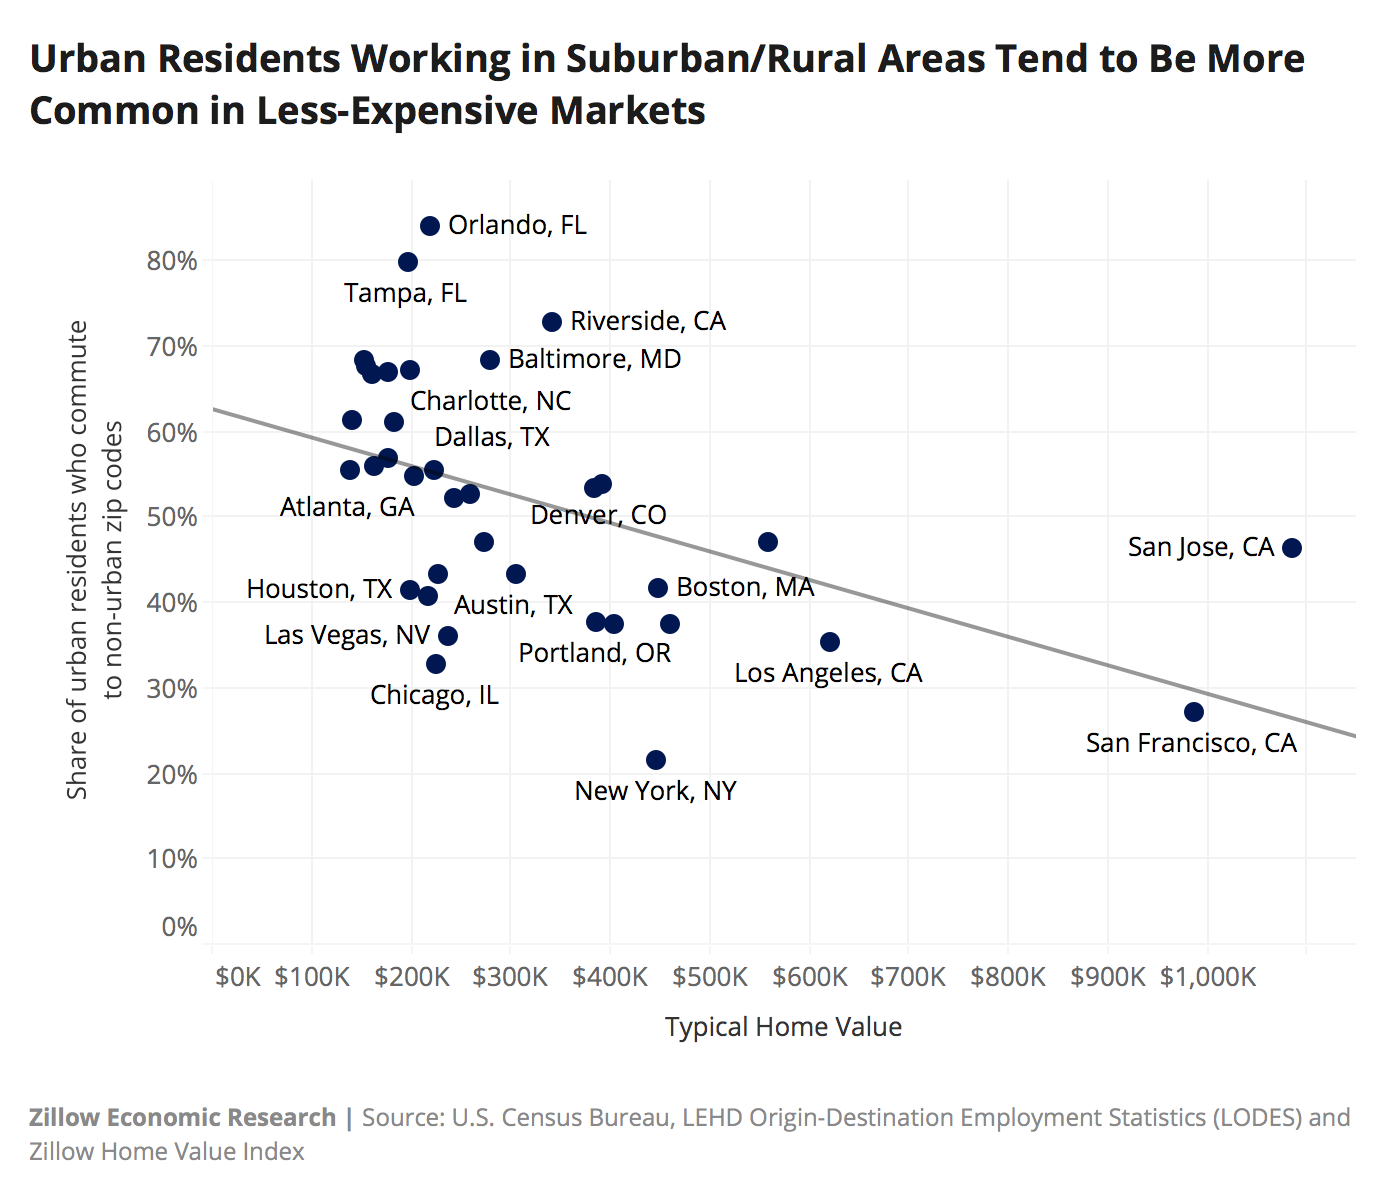
It's a valid question, and it's likely too soon to have a definitive answer. But that question also ignores the millions of U.S. workers already living in urban areas not because of their proximity to work, but in spite of it. As of 2017*, 40% of U.S. residents living in urban areas commuted to non-urban ZIP codes for work — or almost 8.2 million workers nationwide — according to an analysis of data from the federal Longitudinal Employer-Household Dynamics Origin-Destination Employment Statistics (LODES) dataset.
In fact, a majority of urban residents work outside the city in 20 of the country’s 35 largest metro areas, including three (Riverside, Tampa and Orlando) where more than 70% of urban residents work in the suburbs or rural areas. In general, areas with more "urban resident/elsewhere worker" citizens tend to be more sprawling and/or more affordable metros compared to the more stereotypically dense and/or expensive coastal areas like New York and San Francisco.
And these reverse commuters are not unique to the younger population. Nationwide, urban residents aged 55+ are almost equally as likely to commute to suburban and rural areas as those 29 and under. And in some metros, including Washington, D.C., the older generation is more likely to look outside densely populated cities for work.
Ultimately, even if remote working options become both more permanent and widespread, it is unlikely that urban movers will completely abandon cities altogether, since they are so much more than job centers. The rich culture, art, and history found in urban centers is not accessible from the suburbs, and even less so from rural areas. The already large population of urban commuters suggests these attitudes will change very slowly, if at all.
Methodology
Zillow used U.S. Census Bureau Longitudinal Employer-Household Dynamics Origin-Destination Employment Statistics (LODES) data to determine the ZIP code of both individuals' home and workplace cut by age groups. *This data is primarily from 2017, but Alaska and South Dakota report 2016 LODES data. Zillow then matched the ZIP codes of home and work locations to urban, suburban, and rural classifications. Urban, suburban and rural classifications are based on survey results where respondents were asked to describe their home area as urban, suburban, or rural, and then extrapolated to all ZIP codes by comparing population density. The population examined for this analysis is those who reside in urban ZIP codes and work in non-urban ZIP codes.
Pending home sales fell sharply in April. For the tenth straight week, U.S. workers filed more than a million unemployment claims. And national GDP declined in Q1 by more than first thought.
April pending home sales fell to their lowest level on record
The NAR reading of pending sales – measuring transactions in which the contract has been signed, but the deal has not yet been closed – fell to 69 in April.
The 21.8% monthly decline was the largest since the spring of 2010.
More than 20% of the workforce is receiving unemployment assistance or waiting for approval
In total, 3.1 million claims were filed for unemployment benefits last week.
The headline measure of continuing claims fell by 3.7 million, but this number is misleading.
The Q1 slowdown in economic growth was sharper than first estimated
GDP fell at an annualized rate of 5.0% in Q1 2020, a faster pace than the previously stated 4.8% reduction.
A downward revision in private inventory investment was the principal reason for the adjustment.
So what?
The second-straight steep month-over-month fall in pending home sales shouldn't come as much of a surprise — even if the headline numbers are a bit eye-watering.Contract signings – but not closures – on sales of existing homes were always going to take a hit in April, as the entire country was shut down due to the coronavirus, the labor market was reeling and people were still trying to fathom how the world was going to operate amid the pandemic. Some indicators of housing demand – like for-purchase mortgage application activity – have shown a remarkable recovery in recent weeks, but they were still at or near recent lows for much of the month of April. May's pending sales data will be a much better indication of how well this seeming increase in demand can translate into actual home sales. One potential roadblock to improved sales rates will be low levels of for-sale inventory.Levels of new listings have shown improvement in recent weeks, but overall inventory remains well below last year's levels. Sales will be constrained by supply side shortages even if/when demand signals persist.
Another week and another brutal report on the number of claims for unemployment insurance. Some are expressing hope in the fact that the rate of continuing claims – the number of cases in which unemployment benefits are actually being received – is going down, but that figure only tells part of the story. The 3.7 million-person reduction in continuing claims is being largely driven by two states - California and Florida. And both states have quirks in how they report these data: California has a bi-weekly reporting schedule, causing a volatile pattern in their claims' numbers; Florida has had well-documented issues with reporting this entire crisis, making their reported figures less-timely and less-trustworthy. But the broader issue is with the headline figure itself.The continued claims figure does not include applications made through the Pandemic Unemployment Assistance (PUA) program that was designed to help self-employed workers (and others) apply for benefits. Including those figures means that as of May 23, a total of 34.2 million-people were either receiving benefits or would be soon – about 20% of the U.S. workforce. What's more, and more generally, 3.1 million total initial claims (regular + PUA) remains very high by historic measures – more than 3 times higher than the worst week of the Great Recession.The fact that there are still so many claims for unemployment relief being filed this far into the pandemic likely suggests that job losses are a result of business failures rather than temporary slowdowns, and means that the recovery in the labor market will take longer than previously expected.
Lastly, the second estimate for GDP in the first quarter of 2020 suggested that the economy fell even faster in the first three months of the year than first thought. The main driver for this downward revision was a larger-than-first-expected downturn in investment in nonfarm private inventories – in other words, the goods that businesses keep on hand to use in production – which subtracted 1.52 percentage points from overall GDP. Consumer spending, meanwhile, was actually slightly better (or not as bad) than initial estimates. Sales declined, but not by as much as first thought.The release sets the stage for the Q2 GDP reading, which is sure to make the Q1 figures seem paltry. The Federal Reserve Bank of Atlanta's GDPNow model – a running estimate of real GDP growth based on available data for the current measured quarter – predicts that GDP will decrease at an annualized rate of 41.9% in the three months ending in June, which would be the biggest drop since the metric began being tracked quarterly in 1947.
Click here to read past editions of Zillow’s Market Pulse updates.
If psychedelic colors, copious amounts of wood paneling, and wrought-iron railings are your bag, you will love this week’s most popular home on realtor.com®.
It’s a time capsule that has remained relatively untouched for over five decades. Built in 1967, the Missouri home is still in pristine condition—from its hot-pink carpets and hand-carved wood paneling to a selection of bold wallpapers plucked straight from Carol Brady’s vision board.
Originally designed to look like an English manor, the home covers 34 acres and is crammed with architectural gems, for example, hand-carved fireplace mantles and a standout spiral staircase.
Spiral staircase
realtor.com
Out front, there’s an amazing curved porte-cochère that welcomes guests to the estate. Surrounding the ’60s throwback house are more than 34 acres of pastoral land dotted with barns and guesthouses, for a private retreat unlike any other.
The Missouri throwback wasn’t the only oversized property to make our list. Michael Jordan‘s enormous mansion near Chicago continued to rack up clicks, even though it’s been on the market for nearly a decade.
The mansion’s new wave of popularity comes thanks to ESPN’s blockbuster documentary “The Last Dance.”
Even though the price on MJ’s home has been cut a number of times, no buyer has seen fit to roll through the front gates emblazoned with the number “23” and make an offer.
Other homes you clicked on this week included a lavish Tennessee estate with an epic pool party setup, a must-see modern home in Washington, and a waterfront castle—in Kansas City.
For a full look at this week’s most popular properties, simply scroll on down…
Price: $299,000 Why it’s here: Can we get an amen? Built in 1950, this church has been converted into an incredible seven-bedroom home with over 10,000 square feet of living space.
The former sanctuary now serves as an oversized living room and kitchen, and the original bell tower is still intact.
Best of all? Most of the work is done. The converted church boasts new plumbing, fixtures, ceiling fans, and appliances.
Price: $975,000 Why it’s here: Sleek and modern, this exquisite home in the southeast of Washington state was built in 2012. The five-bedroom home sits on a 1.7-acre lot and is loaded with upgrades, including a gourmet kitchen and a biofuel fireplace in the living room.
Outside, the home has a heated saltwater gunite pool with fountains and a guest casita. The home’s stylish appeal resonated with buyers—it’s pending sale after less than a week on the market.
Price: $100,000 Why it’s here: Prepare your paddle! This three-bedroom waterfront home is headed for auction, with an opening bid of $100,000. It must be sold by June 10.
Built in 1963 and totally redone in 2017, it’s built to last, thanks to custom steel reinforcements and a safe room for security. It’s on a large lot close to beaches, shopping, and dining.
Price: $14,855,000 Why it’s here: A rare miss for Air Jordan. The estate of pro basketball’s GOAT Michael Jordan is still on the market and is back on the minds of curious viewers of “The Last Dance.”
Featuring luxe amenities and customizations that were tailored for Jordan’s passions, the 56,000-square-foot mansion was built in 1995 and has been up for sale since 2012.
If buyers ever decide to take a shot, they’ll acquire an estate with a regulation basketball court, gym, circular infinity pool, putting green, tennis court, and cigar room.
Price: $850,000 Why it’s here: Built in 1810, this historically significant property has been impeccably maintained and updated.
The warm, cozy interiors of the four-bedroom home feature original wood-plank floors, two staircases, five fireplaces, and a music room.
It’s surrounded by 35 pastoral acres, with a staggering 16 additional structures on the property, including a guesthouse, summer kitchen, horse barn, shop, and multiuse barn.
Price: $2,395,000 Why it’s here: Formal from every angle and built in 2004, this five-bedroom Tudor estate sits on 3.5 acres and offers over 13,000 square feet of living space.
Frescoes, floor-to-ceiling windows, walnut floors, and beamed ceilings are just a few of the property’s interior highlights. Outside, the gorgeous grounds offer a tranquil respite from everyday life.
Price: $4,995,500 Why it’s here: Inspired by Ashford Castle in Ireland, this five-bedroom Tudor is filled with extraordinary details, like hand-scraped oak floors, original stained glass, a hand-carved fireplace mantle, and an elevator.
Three lots were combined to create this 1-acre property, with its amazing 350 feet of shoreline on Weatherby Lake.
Price: $8,000,000 Why it’s here: It’ll feel like vacation every day at this luxurious mansion, with its amazing outdoor setup.
We love the terraced outdoor entertaining area and pool. The outdoor living area is to die for.
For additional outdoor time, there’s a sundeck, pergola, fire pit, and plenty of patio seating. Inside, the six-bedroom home is loaded with luxe amenities, such as hickory floors, a huge kitchen, and a Creston Smart Home system.
Price: $475,000 Why it’s here: Everyone loves a well-preserved time capsule. If these walls could talk, they’d tell you it’s 1967 all over again. This seven-bedroom home looks relatively untouched from the day it was built, and the interiors aren’t dilapidated in the least.
Peep the deep red carpet in the formal living area, the dark wood cabinetry in the kitchen, and the variety of loud colors and patterned wallpapers throughout the home’s bedrooms.
This week brought more evidence of buyers and sellers returning to the market as newly pending sales and new listings are up from the previous week, and Zillow web traffic on for-sale listings is holding steady well above last year's level. Inventory continues to be incredibly tight — one reason list prices are growing faster than they were in April. Partly on the strength of that rebound, Zillow's forecast now shows an expected 1.8% drop in home prices through October, up from the 2.7% drop expected just weeks ago.
Buyer demand continues to show strength
Newly pending sales are up 40.8% from a month ago and 4.2% week over week. After a dip during the early days of the COVID-19 pandemic in the U.S., the week-over-week change has been positive since the seven days ending April 15.
Page views on for-sale listings on Zillow are up 51% from a year agoas home shopping activity continues to increase. A week earlier, page views on for-sale listings were up 45% year over year.
Inventory is tight, especially with sales activity increasing, but new listings have turned the corner as more sellers are entering the market
Total for-sale listings are down 23.3% year over year in what continues to be an extremely tight market.
New for-sale listings remain down 17.8% year over year, but more recent numbers show more sellers are putting their homes up for sale. They're up 37.8% from last month and 7.2% from a week ago.
List price growth is accelerating
The median list price of homes on the market is $328,927, 2.8% higher than they were a year ago and up 3.5% month over month.
Limited inventory with improving demand is likely keeping pressure on prices.
Zillow economists revise housing market forecast after better-than-expected sales figures in early May
The most recentforecastfrom Zillow's economic research team shows an expected 1.8% drop in prices from April to October 2020, with a slow recovery through 2021.
Zillow economists expect sales volume reached its bottom in early April, about 50% below February levels. Sales are forecasted to recover almost fully by the end of the year.
Purchase mortgage applications are higher than they were a year ago. The share of loans in forbearance continues to grow, but more slowly. And the Fed offered more color and context to the broad economic slowdowns.
For-purchase mortgage applications now up year-over-year
Application activity increased 9% from last week, and now sits 9% above the levels from the same week last year.
Applications are 54% higher than lows hit in April.
8.4% of mortgages are in forbearance, but the growth rate has slowed
The forbearance rate rose just 20 basis points on the week, the smallest increase since the week of March 9.
The biggest gains in forbearance were among loans backed by Ginnie Mae – typically held by borrowers with lower credit.
The Fed's beige book adds color to economic slowdowns
The central bank's report – released eight times a year – emphasized that economic activity decreased in all districts across the country, with most seeing sharp declines.
But some budding signs of optimism were emerging in some sectors.
So what?
After rising for six straight weeks, for-purchase mortgage application activity is now above last year's levels — by a lot. Incredibly, for-purchase mortgage activity has risen 54% from lows reached in early April.Combined with yesterday's surprising increase in new home sales, today's release is another indication that buyer demand remains steady in a market in which prices are still rising and borrowing conditions remain tight even amidst the broader economic slowdown. The question now is whether this steady growth will persist. Some are questioning the longer-term viability of the recovery, stating that much of this bounceback in the market could be due to pent up demand from before the crisis. While that may be, the steady demand suggests that buying activity is gradually improving, rather than sharply recovering.Of course, significant downside risks to buyer demand remain, most notably the enduring downturn in the labor market and delicate plans to reopen the economy. But no matter how you slice it, another solid mortgage applications report is the latest piece of good news for a housing market that is gaining — not losing — momentum.
A separate report released late yesterday by the Mortgage Bankers Association showed that while the share of loans in forbearance continues to grow, the pace of this growth is decelerating, even as job losses and unemployment claims have continued to mount. Forbearance requests as a share of portfolio volume were down from a week prior, and while call volume picked up, wait times and abandonment rates fell, indicating that mortgage servicers are finally prepared for the uptick in activity. That said,there are some lingering concerns underneath the headline figures. Job losses and reductions in income have been felt most strongly by lower-paid workers. This is a likely reason why the share of Ginnie Mae loans (composed of FHA and VA loans – which typically require a smaller down payment and cater to less credit worthy applicants) in forbearance has risen to 11.6% and had the largest weekly increase (34 basis points) of the three categories tracked. The share of Fannie Mae and Freddie Mac loans in forbearance ticked up just 11 basis points on the week, to 9.54%.Overall, the improving trend in forbearance rates is modestly encouraging, but there are many factors still in play that could cause the rate to reaccelerate in the coming months.
The most-recent Federal Reserve Beige Book– a report produced eight times per year ahead of Federal Open Market Committee meetings – offered more color into this downturn, and some signs of subtle recoveries budding in some sectors in certain regions.For example, in New England, cancelled conventions are poised to cost the hotel industry in Boston 200,000 room nights, and a coastal vacation town reported a "stark increase" in bankruptcy inquiries from small retailers in their area. The report also shed light on some budding signs of optimism in some sectors. Businesses in New York appear less pessimistic than in the previous Beige Book report, with multiple sectors expecting a modest improvement to activity in the near-term. And retailers in the Cleveland Fed's district have started to bring back workers that were temporarily laid off.But overall, the report emphasized that economic activity is down nationwide, and employment continued to decrease in all districts. It's important to note that these insights were accumulated about two weeks ago in mid-May, so we'll begin to see if losses can start to fade — and nascent improvements start to more strongly materialize — in the coming weeks.
Click here to read past editions of Zillow’s Market Pulse updates.
Built in 1994, the manor was reportedly purchased by Richard Baker, the governor and executive chairman of Hudson’s Bay Co. The Westchester County residence has since been completely redone.
“The owner just saw the opportunity to buy the project,” says listing agent Leslie McElwreath.
The noted interior designer Steven Gambrel was brought in and, McElwreath adds, “completely transformed it, top to bottom.”
Gone are old-fashioned chintz, Persian rugs, and marble floors. The enormous 31,000-square-foot space now includes a warmer wood flooring underfoot, modern window coverings, and splashes of bright colors to update the look.
The interior spans four floors, with eight bedrooms, eight full bathrooms, and three half-bathrooms. Highlights of the luxe estate include two elevators, six fireplaces, two pools, and a seven-car-garage.
Most expensive home
realtor.com
Reception hall
realtor.com
Red lacquered library
realtor.com
Remodeled kitchen
realtor.com
Family dining banquette
realtor.com
Formal dining room
realtor.com
Living room
realtor.com
Home theater
realtor.com
Indoor pool
realtor.com
The landscaped grounds include reflecting pools.
realtor.com
In addition, the stylish residence comes completely furnished with custom furniture, carpeting, and lighting that Gambrel designed.
It’s a turnkey purchase for a deep-pocketed buyer.
“Someone could literally bring their suitcase,” McElwreath says.
The dwelling is already outfitted with sheets, towels, pots, pans, along with furniture and decor. The only element in the listing photos that isn’t included in the price is the artwork.
The European-style manor offers plenty of options for recreation and relaxation, or perhaps an idyllic telework environment.
The floor plan includes a reception hall, formal living room and dining room, a red-lacquered library (formerly paneled in wood), and a remodeled gourmet kitchen with bar seating.
An adjacent room for casual family dining comes with a built-in banquette.
In addition, the activity spaces include an office, gym, billiard-room, wine cellar, and screening room. A secondary catering kitchen on the lower level allows for large-scale entertaining.
On the second floor, the deluxe owner’s suite includes a bedroom, sitting room, private deck, bath, and two dressing rooms.
In addition, the property boasts both an indoor pool, and a pool outside that is surrounded by a poolhouse and patios.
The grounds, designed by Simon Johnson, feature formal gardens, manicured foliage, and a series of tiled reflecting pools.
“You’ll never see a garden like this at a private residence, McElwreath says, describing it as on the level of a formal botanical garden.
The gated estate, perched at the highest point of a gated community, surrounded by treetops, may appeal to those seeking a refuge from urban life, whether full-time or as a vacation retreat. However, Manhattan and Greenwich are easy commutes.
“It provides a great opportunity for someone who would like to have family and friends close by with all amenities on site,” the agent adds.
A perfect perk in the age of the coronavirus, for a well-heeled buyer who isn’t inclined to travel too far from home this summer.
Sales of newly built homes were unexpectedly strong in April. Consumer confidence appears to be steadying as more parts of the country begin reopening. And most major economic sectors are still shrinking, but some are contracting more slowly than before.
A surprising increase in April new home sales
Sales of new homes rose 0.6% in April from March, crushing expectations for a ~23% monthly decline.
The median sales price of a new home sold in April was $309,000, down 5.2% from March.
Consumer confidence improved in April
The Conference Board's consumer confidence index increased to 86.6 in May, up 0.9 points from April.
Expectations for the next six months remain steady and have risen each of the past two months.
Major sectors still declining, but not as quickly
The Dallas Fed's Texas Manufacturing Outlook Survey improved from April, but still indicates contraction.
The Chicago Fed's National Activity index fell to -16.74 in April, its lowest level on record.
So what?
The coronavirus pandemic has generated any number of nasty surprises over the past few months, but the unexpected strength in April new home sales may be the first pleasant surprise yet - and the clearest indicator so far that housing, so unlike the last time around, will be a source of relative strength during this downturn.New home sales are often a more current measure of activity than existing home sales, and it seems clear that after some initial wobbliness, the market has certainly stabilized. Applications for mortgages have grown strongly over the last month as buyers look to capitalize on record-low interest rates, and builder confidence is showing early signs of coming back from the brink. A 5% monthly drop in new home prices points to builders eager to make deals and deliver for the critical middle segment of the market.The pandemic is almost certain to alter consumer preferences going forward, and a new appreciation for cleanliness and safety might sway more buyers to seek newly constructed, never-lived-in homes in the near future. Even so, construction projects themselves can be slow, and construction activity has slowed recently and will take some time to fully ramp back up - so inventory will remain tight for the foreseeable future. There is still a ways to go before we're completely out of the woods, but today's report is a huge step in the right direction.
Continuing the trend of surprising improvements, a recent bump in a key reading of consumer confidence in May suggests the plunge in sentiment has leveled off and that consumers are optimistic, at least on average, that the economic recovery has begun.Increasingly, it appears that after a period of extreme uncertainty, people are coming to terms with the fact that economic conditions are going to be difficult in the near future, while remaining hopeful of their prospects in the medium- and long-terms. While the index's read on consumers' confidence in present economic conditions fell just slightly, the forward-looking Expectations Index rose for the second straight month and now sits at a higher level than it did in October. There were some interesting differences among age groups: Confidence levels of households headed by someone aged 34 or younger continued to decline in May, while older households (35+) saw sentiment improve.The report also suggested that 5% of households plan to buy a home in the next 6 months, down from 5.3% in April but above November's reading of 4.7%.
Despite encouraging signals in the housing market and modestly hopeful indicators on consumers' outlook, there remains a shortage of hard economic data pointing to a wider recovery.The April national activity index from the Federal Reserve Bank of Chicago – a broad-based measure of national economic performance based on 85 different metrics – plummeted from March to April to its lowest level since at least 1967. But some early signals are starting to emerge that suggest some sectors might be starting to cautiously emerge from cover in May. Released last week, the IHS Markit readings on activity in both the manufacturing and services industries suggest that both of those sectors are still in a significant contraction, but activity is declining at a slower rate. That trend was echoed today by the Dallas Fed's Texas Manufacturing Outlook Survey, which showed continued, but less-severe declines in all of its key indices.The news is by no means "good," but any signs of a bottom or even a near-bottom will be welcome as the economy begins to test the water on a recovery.
Click here to read past editions of Zillow’s Market Pulse updates.
Until recently, the prognosis for the housing market wasn’t great. With the economy in a free fall, home sellers swiftly took down their “For Sale” signs and many buyers chose to wait out the coronavirus pandemic. It was like the pause button was pushed on the normally bustling spring home-buying season.
But as states reopen their economies, the summer real estate market just might turn out to be hotter than anyone was anticipating. For the first time in more than two months, mortgage applications for home purchases were up year over year, rising an impressive 8.7% as buyers raced to lock in record-low mortgage rates in the week ending May 22.
This is according to a weekly survey from the Mortgage Bankers Association that spans more than 75% of U.S. residential mortgage applications. The purchase loans did not include mortgage refinances for those who already own homes.
“This is a bit of a bigger rebound than I expected,” says realtor.com® Chief Economist Danielle Hale. “It’s a sign that we are going to see a delayed seasonal bump in home sales. There’s pent-up demand from people who weren’t able to get out in the early part of the spring, and we’re seeing that [materialize] now.
“Normally we see sales really ramp up in March and April,” she continues. But amid the pandemic and widespread job losses, many Americans wanted to wait not only until they felt more secure in their jobs but also until they could physically step into the homes they were considering.
“We’re going to see that ramp up in June and July,” says Hale.
The recovery may be thanks to folks becoming more comfortable with the idea of embarking on the home-buying process as they’ve gotten used to taking precautions such as wearing masks and keeping social distance. Plus, more sellers are listing their homes now that cities and states are loosening restrictions. And then there are those ultralow mortgage rates, hitting 3.08% on Wednesday for a 30-year fixed-rate loan, according to Mortgage News Daily.
“The low mortgage rates, without a doubt, is helping to entice buyers back into the market,” says Lawrence Yun, chief economist of the National Association of Realtors®. Folks may also look at it as a less volatile investment.
“Real estate may be viewed as a safe asset in the upcoming years,” says Yun.
Despite the highest unemployment since the Great Depression, buyers are also taking out larger mortgages again. The average loan size was about $340,200 in the week ending May 22. That was up from a low of $315,300 this year in the week ending April 3.
While laid-off or vulnerable workers certainly don’t have investment on their minds, today’s intrepid buyers are better off financially—and are typically still employed, says MBA economist Joel Kan.
Before the crisis, purchase applications had been rising about 10% annually. Then they plunged in mid-March as the nation declared a state of emergency, hitting their nadir in early April, with applications down more than 35% year over year. However, as time passed and states began reopening, more would-be homeowners began submitting applications again. In the previous week, applications were down only 1.5% annually in the seven days ending May 15.
“The pandemic really hit us right at the time when home-buying activity really ramps up,” says Kan. That’s resulted in “a late home-buying season.”
The recovery has been uneven, though, with the number of purchase applications remaining well below normal levels in the hardest-hit states. In New York, the nation’s COVID-19 epicenter, purchase applications were still 16.9% less than a year ago in the week ending May 22. However, that was a big improvement over the previous week, when applications were down 32.8%.
In Washington state, applications were 23.1% below the same week last year, while in California they were down only 1.7%.
Despite the encouraging national numbers, it’s likely too soon to declare a roaring comeback for the housing market.
“I’d want to wait a couple of weeks so we know that this is really a trend and not a one-time blip,” says Hale.
Plus, there is still a severe housing shortage, which has only gotten worse during the public health crisis. Many sellers have pulled their properties off the market or are holding off on listing their abodes until the virus is under control and they can fetch top dollar for their residences. That can make it tough for buyers to find the right properties.
“Sellers haven’t come back as quickly to the market as buyers have,” says Hale. “Buyers may be surprised by how competitive the market is.”
This could result in higher prices this summer, as there will be more folks competing for homes than homes for sale.
“Given the strength of this recovery, home prices will probably rise about 4% to 6% in 2020,” predicts NAR’s Yun.
Hale also believes prices could go up and stay that way through the late summer. But if the coronavirus resurges in the fall and the economy continues to falter, prices could flatten or even dip a tiny bit by the end of the year. They’re not likely to plunge like they did during the Great Recession, though, as demand is simply too high.
“We have so many millennials who are at ages when they want to settle down and they want to buy a home, and that really helps keep the market busy,” says Hale.
There are so many things to consider when looking for the right home: Is it located in a good neighborhood with an easy commute to work? Does the price tag fit within the budget? And perhaps most importantly, does it have everything that Fido and Tigger need to live long, happy lives there?
Almost 95% of pet owners said they considered the needs of their furry friends to be important when selecting the right home to buy, according to a recent realtor.com® survey.
More than 2,000 buyers participated in the survey conducted in March in which roughly 82% of respondents were pet owners. About 61% of participants were dog owners, 45% were cat owners, 12% were fish owners, and 9% had birds. Some folks had multiple pets.
“We believe that a home is so much more than a roof and four walls. It is where family and friends come together and memories are made,” realtor.com Chief Marketing Officer Nate Johnson said in a statement. “The results of this survey reinforce that our pets are our family and an important part of what makes a house a home.”
The top home features for pet parents were big yards, at 38%, and outdoor spaces, at 29%. Those four-legged companions need ample space to run around and sun themselves so they don’t wreck the house! Pet owners also prioritized garages, at 24%; dog runs, at 22%; and lots of indoor square footage, at 20%.
That could help to explain why 68% of pet owners would pass on their dream house if it didn’t accommodate the needs of their animals. Clearly, it wasn’t perfect if it there were too many stairs for Couscous or it was a little too close to the highway for Mr. Giggles.
It may not be surprising that, among the survey respondents, 87% of dog and cat owners rated their pets’ needs as extremely or very important when selecting a home. But 89% of bird owners, 85% of fish owners (really?), 79% of rodent owners (eww!), and 74% of horse owners also said they would also consider their animals before purchasing a property.
For baby boomers, the question of when—and where—they’ll retire is a perennial topic of discussion. But with the novel coronavirus sweeping the globe, it has become an especially pressingquestion these days.
Many are feeling the pressure to ramp up their decision-making and act fast—between concerns over COVID-19 contagion, rampant layoffs, and new rounds of self-reckoning where they ponder “Why wait to realize my dreams?” Many believe that the time is now to make real estate decisions they’ve been putting off—or they’re changing course entirely.
Whether you’re a boomer yourself or just paralyzed about your next move, these stories might inspire you to get unstuck, or at least realize that you aren’t alone. Here’s how the current coronavirus crisis has radically transformed three people’s best-laid real estate plans for the better.
‘COVID-19 convinced me to stay put’
COVID-19 convinced Kristin Donnan to stay where she was.
Kristin Donnan
Kristin Donnan, 57, an author and arts advocate, had her retirement house all picked out: a one-level cottage in a vibrant, bustling 55-plus community near San Diego. She was preparing to make an offer.
There was just one thing she had to do first: Help her mother sell the property where she’d grown up in Hill City, SD. With 20 tree-filled acres, three buildings, and a barn, it needed some sprucing up and purging before it could fetch top dollar.
Donnan had moved back home temporarily to assist her mother in readying the compound, but had vowed to move on with her own plans once the property sold. But no buyers came knocking, and then the COVID-19 pandemic hit.
By April, “my urban friends in California were telling me what lockdown looked like,” Donnan says. This prompted her to reconsider her plans to return to the “civilization” where she’d always assumed she’d end up.
“A lot of things made me think about leaving Hill City—including politics and the scarcity of cultural activities,” she says. “I was eager to return to the conveniences of Southern California, willing to deal with traffic, too many people, earthquakes, smog, blackouts … until COVID-19.”
While Hill City may lack California’s cultural buzz and arts scene, she realized there was value in “being out of the rat race and out of the panic,” she explains. “The danger is very low here. My yoga studio just reopened. I can go to the grocery store, take a hike, visit others who are as isolated as I am, see a friend for tea. It’s calming.”
So although her mother’s house is still for sale, Donnan’s life plans have changed course.
“I’ll stay here until it sells and then move elsewhere in the area,” she says. “There are events like wars and 9/11 that change everything. This is one of those moments. The pandemic has made me realize the benefits of having a place in rural America.”
‘COVID-19 motivated us to sell our home ASAP’
COVID-19 convinced Allyson and her husband to put their Westchester, NY, house on the market.
Courtesy of Allyson
Allyson, 60, a college consultant, and her husband, Al, a psychiatrist, always knew they’d sell the Westchester, NY, house where they’d raised their kids someday. The coronavirus, however, prompted these empty nesters to fast-forward their home-selling plans to right now.
“Selling our house has definitely become a priority,” Allyson says. The underlying motivations for unloading their Colonial—“our high taxes, not having kids in the schools anymore, and having more house than we need”—hadn’t changed. So what had?
“I heard that many New York City residents are trying to quickly move to the suburbs,” Allyson explains. “I plan to hustle to get my house on the market and take advantage of that.”
Allyson says she’s been talking with a friend who is a real estate agent, and is busy booking a painter and handyman to get her home in perfect shape for prospective buyers.
Since hiring professionals to come to the house is still dicey, the place may not hit the market until late summer or early fall, but it will definitely happen this year. Although it’s stressful to deal with this work and a move during the coronavirus pandemic, they feel glad to get the wheels in motion for a process that can take many people years to accomplish.
As for where they’ll move next, they haven’t figured that out quite yet. But they are all but certain it will be farther away from the city, not closer. The coronavirus has crystallized that for them.
“I am a little fearful of living near New York City now primarily because of the density: What if this goes on and on or happens again?” she says. “I don’t want to be cooped up with no place to go.”
‘COVID-19 convinced me to move to my retirement home early’
David has been shopping for his retirement home in Panacea, FL, where costs are about half of where he lives in Boston.
realtor.com
David, 66, who lives in Boston, thought he’d stay a New Englander for a few more years. But the COVID-19 pandemic galvanized his long-simmering plans to head south.
“I grew up in Georgia and miss some aspects of Southern life, including the weather,” he explains. “That becomes a bigger deal every year. But I wanted to keep earning as much as I could until age 70, the way you’re supposed to if you want the biggest Social Security income.”
However, since he works in fundraising for an arts organization, he’s seen his work hours dramatically reduced since COVID-19 came to town.
“Our organization came to almost a full stop, and, while still employed, I took a significant salary cut,” he says. “And the fact that the arts will be among the last areas to reopen in hard-hit states makes me think my work life is over.”
David chooses to look at this as a glass half-full.
“It’s a sign to move on to the next phase of life,” he says. “I’ve been talking about buying a little, cheap, beach-bum place in Florida for years. Now, I’m ready. This virus has brought me face to face with my mortality. The time to realize my dreams is now. There are no guarantees.”
He is actively searching online for a cottage or condo near the water in the vicinity of Tallahassee, FL. Working with a local real estate agent, he’s doing virtual walk-throughs on FaceTime. While he’s not sure if he’ll actually buy a house sight unseen, he’s excited to be laying the groundwork for the next phase of his life.
“Right now, I’m terrified to go to the Public Garden [in Boston] to see the flowers in bloom,” he says. “The idea of having a laid-back life, listening to the surf, going fishing in Florida, that will be heaven! For me, this tragedy has a silver lining.”
April existing home sales fell sharply, but by slightly less than expected. Mortgage delinquency rates nearly doubled in April, largely because of forbearance programs. And claims for unemployment insurance rose last week from the week before.
Sales of existing homes fell sharply in April
Sales fell 17.8% from March, the largest one-month decline since 2010.
The 4.33 million homes sold in April was the lowest monthly total since 2011.
Forbearance programs drive a near-doubling in mortgage delinquencies
According to Black Knight, 6.45% of mortgages were at least 30 days past due in April, up from 3.06% in March.
Loans that are in forbearance are considered delinquent in this report.
Labor market carnage continues
A total of 4.4 million claims for unemployment insurance were filed in the week ending May 9.
Over half of those (2.23 million) were claims for Pandemic Unemployment Assistance (PUA), a program designed to help previously ineligible people receive relief.
So what?
The April existing sales figures were always going to be bad. While sales took a significant step back in March, April's report is the first one to truly capture the change in buyer activity since the coronavirus broke out on U.S. soil. The combination of fear, economic uncertainty and mandatory stay-at-home orders generated by the pandemic brought huge portions of the economy to a crashing halt and prevented many home shoppers and sellers from participating in the market.The question now is what happens from here. April's report was bad, but it could have been worse - price growth remains strong and inventory is very low, keeping competition high for those buyers still on the market. May's sales figures – which represent buyer activity in April or even late March – certainly won't be a blockbuster but will likely show some faint signs of improvement.Either way, it's clear that as the country begins to slowly reopen, buyer demand for homes remains sturdy and many are eager to take advantage of record low interest rates to get in on the action. It appears the worst may now be behind us and that home sales are at least at the start of the road to recovery.
The April surge in mortgage delinquencies was also largely inevitable. Black Knight considers all mortgages in forbearance programs as delinquent, and as of May 12, slightly more than 8% of all loans (about 4.7 million) were receiving this form of assistance.Nevada, New Jersey and New York – three states that bore substantial health and economic impacts from the coronavirus in April – experienced the largest increase in payment tardiness of any states. Miami – home to the world's busiest cruise ship port – saw a similarly large spike, and had the largest monthly increase of all metro areas. As participation in forbearance programs continues to grow, delinquency rates are also likely to continue to rise, possibly to the all-time highs set during the Great Recession. The question remains, though, how many of those loans in forbearance will avoid progressing into foreclosure, as assistance expires and payments become due again.The future path of any additional aid and of improvements in the labor market are two pivotal pieces that will help prevent a surge in foreclosures.
As the U.S. coronavirus crisis nears its tenth week, the damage to the labor market continues to be devastating. The headline number of unemployment claims decreased slightly from last week, but remains very high by historic standards. But when including applications for Pandemic Unemployment Assistance (PUA) – a new program created to allow self-employed people, independent contractors, and others who don't qualify for traditional unemployment benefits – suggests that overall claims grew significantly from the week before. There were more claims for PUA this week than there were for traditional benefits. The PUA number might be misleading and is difficult to attribute to a specific week, since the program is new and may still be processing a backlog of claims from workers previously ineligible for relief even a month ago.But no matter how you calculate it, the fact that the number of jobless claims remains this high this long into the crisis is a glaring issue. It suggests that the chasm in the labor market is much deeper than anyone expected at the onset of the crisis, and that there is a high risk of job losses once considered to be temporary turning into more-permanent downsizings.A working research paper from Stanford suggests that as many as 42% of recent layoffs will result in permanent job losses, as social distancing and changing consumer behaviors will limit volume in certain industries, leaving a need for fewer workers.
Click here to read past editions of Zillow’s Market Pulse updates.
The S&P CoreLogic Case-Shiller U.S. National Home Price Index® rose 4.4% year-over-year in March (non-seasonally adjusted), up from 4.2% in February. Annual growth was also up from January in the smaller 10-city index (to 3.4%, from 3%) and 20-city index (to 3.9%, from 3.5%).
Phoenix (+8.2%), Seattle (+6.9%), and Charlotte (+5.8%) reported the highest year-over-year gains among markets in the 19-city index (Detroit was excluded from the 20-city index this month).
On the surface, the solid and steadily accelerating growth in home prices in March paints the picture of a housing market and an economy that was on stable footing.
The national Case-Shiller Home Price Index rose 4.4% year-over-year in March. The smaller 10- and 20-city composite indices grew more slowly, at 3.4% and 3.9% year-over-year, respectively. The annual rate of growth was higher in March than in February in all three indices. On a monthly (seasonally adjusted) basis, the 10- and 20-city indices were up 0.4% and 0.5%, respectively, from February; the national index was up 0.5% month-over-month.
Index
Zillow Forecast, Released 4/28/20
Actual Case-Shiller Indices,
Released 5/26/20
Historical Median Absolute Error*
10-City Composite,
Month-Over-Month (SA)
0.3%
0.4%
0.2%
10-City Composite,
Year-Over-Year (NSA)
3.3%
3.4%
0.2%
20-City Composite,
Month-Over-Month (SA)
0.4%
0.5%
0.2%
20-City Composite,
Year-Over-Year (NSA)
3.8%
3.9%
0.1%
U.S. National
Month-Over-Month (SA)
0.4%
0.5%
0.1%
U.S. National
Year-Over-Year (NSA)
4.4%
4.4%
0.1%
*Calculation of Median Absolute Errors are based on Zillow’s forecasts dating to 2011. The national Case-Shiller forecasts began in 2014.
But in reality, the world was anything but steady in March, as the coronavirus was first starting to inflict health concerns and cause economic carnage on U.S. residents, businesses and industries. That said, relative to the broader economy, the housing market – particularly home prices – have gotten away more or less scot-free so far. The strong buyer demand heading into this crisis has held fairly steady in the months since the outbreak, as record-low mortgage rates and inventory levels have maintained competition in the markets and placed upward pressure on home prices. So much remains uncertain – including the longer-term path for home prices – but for now, competition for homes is holding strong and keeping prices afloat.
Annual growth in April as reported by Case-Shiller is expected to accelerate in the 10- and 20-city indices, and stay steady in the national index. S&P Dow Jones Indices is expected to release data for the April S&P CoreLogic Case-Shiller Indices on Tuesday, June 30.
Index
Actual March
Case-Shiller Change
Zillow’s Forecast for the Case-Shiller April Indices
10-City Composite,
Month-Over-Month (SA)
0.4%
0.3%
10-City Composite,
Year-Over-Year (NSA)
3.4%
3.7%
20-City Composite,
Month-Over-Month (SA)
0.5%
0.3%
20-City Composite,
Year-Over-Year (NSA)
3.9%
4.2%
U.S. National
Month-Over-Month (SA)
0.5%
0.4%
U.S. National
Year-Over-Year (NSA)
4.4%
4.4%
Note: Case-Shiller and Case-Shiller Index are registered trademarks of CoreLogic Solutions, LLC. The statements herein are not endorsed by or provided in association or connection with CoreLogic, LLC.
April new home sales were up 0.6% from March, to 623,000 (SAAR), according to the U.S. Census Bureau — consensus expectations were for a 23% monthly decline. Sales were down 6.2% from April 2019.
The median sales price of new houses sold in April 2020 was $309,900, down 5.2% from March.
Inventory of new homes for sale in April was down 1.8% from March and down 3% from a year ago.
The coronavirus pandemic has generated any number of nasty surprises over the past few months, but the unexpected strength in April new home sales may be the first pleasant surprise yet — and the clearest indicator so far that housing, so unlike the last time around, will be a source of relative strength during this downturn. New home sales are often a more current measure of activity than existing home sales, and it seems clear that after some initial wobbliness, the market has certainly stabilized. Applications for mortgages have grown strongly over the last month as buyers look to capitalize on record-low interest rates, and builder confidence is showing early signs of coming back from the brink. A 5% monthly drop in new home prices points to builders eager to make deals and deliver for the critical middle segment of the market. The pandemic is almost certain to alter consumer preferences going forward, and a new appreciation for cleanliness and safety might sway more buyers to seek newly constructed, never-lived-in homes in the near future. Even so, construction projects themselves can be slow, and construction activity has slowed recently and will take some time to fully ramp back up — so inventory will remain tight for the foreseeable future. There is still a ways to go before we're completely out of the woods, but today’s report is a huge step in the right direction.
The long weekend signals the kickoff of the summer grilling season, and our thoughts have turned to cooking outdoors.
With visions of tasty grilled meats and veggies making their way through our minds, we looked at tantalizing outdoor kitchens in luxury homes for sale.
We love an al fresco cooking space, preferably one with stainless-steel appliances, a great view, and plenty of room to (safely) host guests. We’ve spotted eight homes with absolutely scrumptious setups.
And given the ongoing ripple effects of the pandemic, the emphasis on a particularly appetizing outdoor space may be way more than an afterthought for home buyers.
Let these backyard banquet spaces serve as inspiration. Even if you’re not considering a move, it’s always fun to take in on some of the most droolworthy open-air cook spaces around.
So pour a glass of rosé, light the charcoal, and tour these eight great outdoor kitchens…
Kitchen confidential: Cook all day at this spectacular outdoor kitchen, which features a barbecue, pizza oven, and full dining area.
The kitchen and the two-story beach front villa sit on approximately 2.78 acres with a pool and path down to the beach.
Designed by architect Doug Burdge, this mansion, built in 2010, has a seamless indoor-outdoor space for entertaining. The main level offers an ocean-view great room, double-height living room, dining area, plus a home theater, billiard-room, and ocean-view master suite.
When you’re done cooking, there’s a 2,500 square-foot rooftop terrace with a fire pit.
Kitchen confidential: Leave it to the wine country to offer a primo place for a movable feast.
This kitchen features plenty of counter space, a barbecue, pizza oven, and bar seating. Located on a grand Napa Valley estate of 40 acres, the property includes acres of vineyards and panoramic views.
Meanwhile, you’ll have no problem pairing a vintage with your meal—the 9,600-square-foot main residence includes a wine cellar and tasting room. The grounds feature patios, terraces, pool, lawns, orchards, an organic garden, and a guest casita.
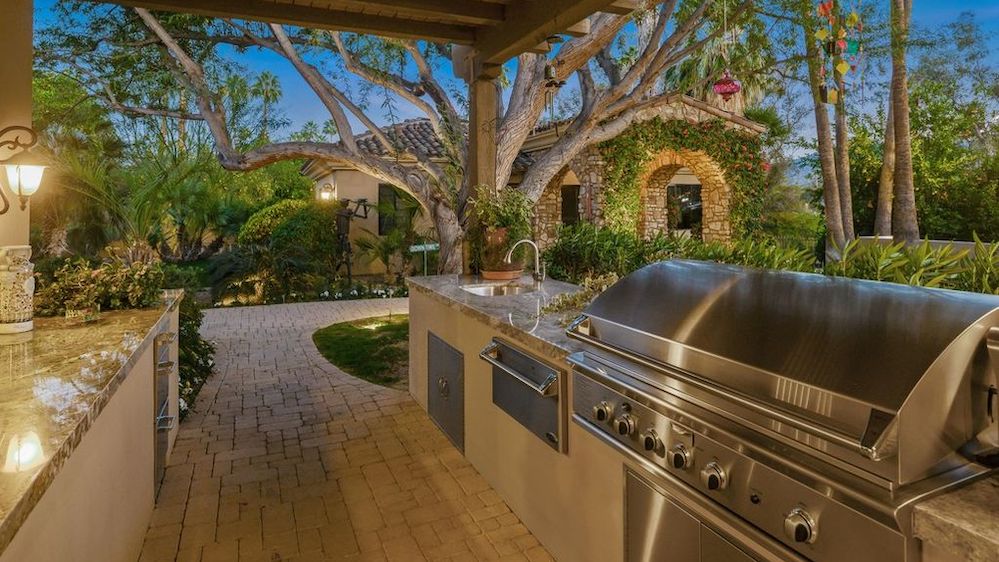
Kitchen confidential: No mirage here! Built in 1979, this Coachella Valley property has been completely renovated inside and out.
It now features an “ultimate” outdoor kitchen with a pass-through window to the main residence.
The indoor-outdoor living spaces also feature a stone arched loggia enclosing the outdoor living area, with a fireplace. The five-bedroom residence offers a media room with bar and fireplace, office, and a 700-bottle wine cellar.
Kitchen confidential: Built in 2016, this private seaside estate lacks for nothing. Whip up an outdoor feast from your outdoor kitchen with water and coastline views.
Other outdoor features include a dining area, infinity pool, soaking spa, and lawn. The five-bedroom, French-inspired manor is made from stucco and limestone, with modern interior spaces, high ceilings, and floor-to-ceiling windows.
Kitchen confidential: We can’t resist a kitchen with a view. This modern waterfront beach house in the heart of South Beach offers an outdoor paradise.
Fully renovated inside and out, it has a well-equipped outdoor kitchen and entertaining lounge—surrounded by tropical gardens.
The rooftop deck offers sumptuous views of the Sunshine State. Inside, you’ll find a bar, wine storage, as well as a separate kids’ wing. (You might really appreciate that concept these days.)
Kitchen confidential: Built in 2018, the modern Craftsman offers custom amenities and overlooks Lake Gaston.
The picturesque property features an outdoor kitchen with a pizza oven, fire pit, and outdoor seating.
With over 7,000 square feet, the interior living area includes two full kitchens, a theater, exercise room, and wine cellar. In addition, the lakefront home features a deepwater boathouse.
Suburban home listings are not currently getting any more attention on Zillow than last year, relative to urban or rural listings. Total page views on suburban homes are up from a year ago.
Traffic to rural listings was up 0.9 percentage points year-over-year in April; urban up 0.8%; suburban down 1.5%.
Some metros hit hardest by the coronavirus saw a rise in traffic to listings entirely outside the metro area.
The coronavirus pandemic has sparked questions about the future of cities: Will a new fear of density cause people to flee urban cores for more spread-out suburbs or rural areas? So far, Zillow data suggest the answer is "No."
Zillow compared web traffic to for-sale listings on Zillow in ZIP codes considered urban, suburban or rural in April 2019 and April 2020. In both 2019 and 2020, suburban listings garnered the majority of page views from Zillow users, but there has been no suburban surge this year in the wake of the pandemic. Total page views on suburban homes is up year-over year, but their share of all views to urban, suburban and/or rural areas is down: Suburban home listings nationwide saw their share of the pie shrink slightly this April compared to a year ago, from 65.7% of all page views to 64.2%. The suburbs' loss has been other regions' gain: rural listings rose from 23.4% to 24.3% of all traffic, and urban listings grew from 10.8% to 11.6% of all traffic.
It's unclear what's driving these small differences in monthly shares of web traffic, and it may simply reflect random variation over time. But the data do not provide any early evidence for an overall shift in search behavior away from urban cores, even as survey data point to shifting attitudes.A recent Zillow surveyfound that a majority of people who recently began working from home would consider moving, particularly to find a home with a dedicated home office or generally more space — features traditionally found more easily in the suburbs. But if these stated preferences are or will soon lead to real-world moves, we haven't seen it in the data yet.
Local Variation
In metropolitan areas hit particularly early or hard by the pandemic, the web traffic data do tell some interesting stories. The New York City metropolitan area has seen a dramatic rise in the share of its residents' web traffic looking at homes inothermetro areas. The share of page views from New York-area users ending up at homes outside the New York metro rose from 34.8% in April 2019 to 40.1% last month, one of the largest such increases among major metro areas, and one not in line with national trends. Nationwide, the share of out-of-town page views was virtually identical this year at 48.1%, compared to 48.2% last April. For New Yorkers looking farther afield, the fastest rising out-of-town destination is Miami, where listings drew 3% of New Yorkers' page views, up from 2.2% last year. Other large metros more popular with New York home searchers this year compared to last include Atlanta (search traffic is up to 1.4% from 0.9% a year ago) and Los Angeles (up to 1.3% from 0.8%).
Some other metro areas hard-hit by the pandemic are also seeing resident Zillow users turn their attention to out-of-town listings: Detroit saw it rise from 31.4 to 44.1% of traffic; Boston saw it rise from 49.7% to 55.0%. This year's newly more-popular search destinations from Detroit included Grand Rapids, and, perhaps surprisingly, the Boston and New York metro areas. Bostonians had the most growth in traffic for listings in the nearby Providence, Cape Cod, and Portland (Maine) metro areas. It's too soon to tell if those rises in outward-looking traffic shares reflect a long-term shift, or if local home shopping has been more impacted in these metros in the short-term because local lockdowns have been particularly sharp in these areas.
On the other hand, residents of West Coast metros seem even more eager to stick around their current homes. The Seattle metro area, home to the first confirmed COVID-19 case in January, saw outward-looking traffic stay virtually flat, shrinking from 56.4% of all page views in April 2019 to 55.9% in April 2020. In San Francisco, outward-facing traffic shrank from 62.6% of views to 60.7% over the same period. In Los Angeles, outward-bound traffic represents less than half of page views originating from the market, though it did rise somewhat over the past year, from 47.9% to 49.2% of web traffic.
Extending the Cord, Not Cutting It
Among in-metro searches, a large majority do end up in the suburbs, but not any more than last year — and in fact, slightly less: The share of in-metro searchers looking at listings in the suburban parts of their current metro areas shrank from 73.2% last year to 72.9% this year. And the share of traffic to listings in urban areas actually rose somewhat, to 13.8% in April 2020 from 13.5% in 2019. Broadly, these changes are minuscule, but if we were going to see an emerging flight to the suburbs, we would see it in this data first. Enticed by more affordable and spacious suburban homes and/or less-tethered to a downtown office and regular commute, urban residents may soon look outside the city if and when currently temporary changes in work environments become more permanent.
Even then, though, it is unlikely that movers will completely abandon the city and its numerous amenities — including culture, arts, nightlife and history — that can't be found in the suburbs or the country. It's very likely that movers won't entirely cut the cord with their nearest urban center — rather, they may exchange it for a slightly longer extension cord. And that says nothing of the millions of U.S. workers living in urban areas but commuting to the suburbs or rural areas for work. More than third of workers in the Seattle metro and more than half in Minneapolis-St. Paul do so, trends echoed in many large metros. This signifies a sizable population more likely to be uninterested in leaving the city for the suburbs even if the option for remote work was more widespread.
The share of traffic ending up in the suburbs was smaller this year than last year in all of the nation's 35 largest metro areas. In the west coast metros highlighted above, there is also no local story of rising suburban preferences. Local-originated traffic to Seattle-area listings shifted in favor of urban ZIP codes, which took 26.7% of the page views, up from 25.0% in 2019, while suburban listings slipped from 68.9% to 67.4%. San Francisco similarly saw a slight suburban slide for those looking close to home, from 61.0% to 60.3% of local-originated traffic, while urban listings gained share, from 37.3% to 38.0%.
And Zillow users looking beyond their metro area are also not flocking to suburban listings. Nationwide, among people specifically looking at listings outside their own metro area, the share of traffic going to suburban listings shrank from 62.8% to 60.7%. And traffic to urban listings in other metro areas picked up most of the suburbs' lost share, growing from 8.6% to 9.9%. Rural areas, which always comprise a disproportionately high share of out-of-metro page views, grew from 28.6% to 29.5%. Even among New Yorkers — who might be imagined to be perusing remote, forested cabin retreats — the share of out-of-town traffic directed at urban listings rose this spring, from 12.1% to 13.0%, similar to the increase in their interest in out-of-metro rural listings (up from 18.4 to 20.0%).
Overall Traffic is Up
All of this is not evidence of a drop-off in interest in moving — it only suggests people may not be interested in moving terribly far from their current homes, or in exchanging their urban locale for a quieter, less-dense suburban neighborhood (at least, not yet). After rebounding in April, overall web traffic to for-sale listings on Zillow has continued to surge beyond year-ago levels so far in May. For the week ending May 10, overall traffic was up 42% from the comparable week in 2019, suggesting a wave of pent-up demand from home buyers stymied by the pandemic so far this spring. Traffic to listings in all kinds of neighborhoods is up this spring: Listings in urban areas got 23% more traffic this April than last; rural listings got a 19% year-over-year boost and views to suburban listings were up 12% from a year ago.
Methodology
All page view events of for-sale homes on Zillow.com and the Zillow app are tabulated for April 2020 and 2019; the listing's ZIP code and user's city, which are then aggregated to origin/destination MSA and our proprietary urban/suburban/rural classification. That division is based on survey results where respondents were asked to describe their home area as urban, suburban, or rural, and then extrapolated to all ZIP codes by comparing population density. Page views exclude real estate agents and other professional users on Zillow in order to better measure demand. Year-over-year comparisons are done after offsetting 2019 data by 2 days, in order to compare the same days of the week, e.g. we compare Wednesday, April 1, 2020 with Wednesday, April 3, 2019.