Wednesday, July 31, 2019

5 Myths (and 5 Truths) About Selling Your Home

Everyone has advice about the real estate market, but not all of that unsolicited information is true. So when it comes time to list your home, you'll need to separate fact from fiction.

Below we’ve identified the top five real estate myths - and debunked them so you can hop on the fast track to selling your property.

1. I need to redo my kitchen and bathroom before selling

Truth: While kitchens and bathrooms can increase the value of a home, you won't get a large return on investment if you do a major renovation just before selling.

Minor renovations, on the other hand, may help you sell your home for a higher price. New countertops or new appliances may be just the kind of bait you need to reel in a buyer. Check out comparable listings in your neighborhood, and see what work you need to do to compete in the market.

2. My home’s exterior isn't as important as the interior

Truth: Home buyers often make snap judgments based simply on a home's exterior, so curb appeal is very important.

"A lot of buyers search online or drive by properties before they even enlist my services," says Bic DeCaro, a real estate agent at Westgate Realty Group in Falls Church, Virginia. "If the yard is cluttered or the driveway is all broken up, there's a chance they won't ever enter the house - they'll just keep driving."

The good news is that it doesn't cost a bundle to improve your home's exterior. Start by cutting the grass, trimming the hedges and clearing away any clutter. Then, for less than $50, you could put up new house numbers, paint the front door, plant some flowers or install a new, more stylish porch light.

3. If my house is clean, I don't need to stage it

Truth: Tidy is a good first step, but professional home stagers have raised the bar. Tossing dirty laundry in the closet and sweeping the front steps just aren’t enough anymore.

Stagers make homes appeal to a broad range of tastes. They can skillfully identify ways to highlight your home’s best features and compensate for its shortcomings. For example, they might recommend removing blinds from a window with a great view or replacing a double bed with a twin to make a bedroom look bigger.

Of course, you don't have to hire a professional stager. But if you don't, be ready to use some of their tactics to get your home ready for sale - especially if staging is a trend where you live. An unstaged house will pale when compared to others on the market.

4. Granite and stainless steel appliances are old news

Truth: The majority of home shoppers still want granite counters and stainless steel appliances. Quartz, marble and concrete counters also have wide appeal.

"Most shoppers just want to steer away from anything that looks dated," says Dru Bloomfield, a real estate agent with Platinum Living Realty in Scottsdale, Arizona. "When you a design a space, you need to decide if you’re doing it for yourself or for resale potential.”

She suggests that if you're not planning to move anytime soon, decorate how you’d like. But if you’re planning to put your home on the market within the next couple of years, stick to elements with mass appeal.

"I recently sold a house where the kitchen had been remodeled 12 years ago, and everybody thought it had just been done because the owners had chosen timeless elements: dark maple cabinets, granite counters and stainless steel appliances."

5. Home shoppers can ignore paint colors they don't like

Truth: Moving is a lot of work, and while many home buyers realize they could take on the task of painting walls, they simply don't want to.

That's why one of the most important things you can do to update your home is apply a fresh coat of neutral paint. Neutral colors also help a property stand out in online photographs, which is where most potential buyers will get their first impression of your property.

Hiring a professional to paint the interior of a 2,000-square-foot house will cost about $3,000 to $6,000, depending on labor costs in your region. You could buy the paint and do the job yourself for $300 to $500. Either way, if a fresh coat of paint helps your home stand out in a crowded market, it's probably a worthwhile investment.

Related:

Originally published April 1, 2014.


via 5 Myths (and 5 Truths) About Selling Your Home

Financial Crisis Yields a Generation of Renters

This Stylish Treehouse Is Luxury Off-the-Grid Living

Kati O'Toole and her husband, Darin, wanted to create a giant piece of artwork on their private and heavily wooded seven-acre property in Montana. They ended up with what they refer to as the Montana Treehouse Retreat - a two-story, fully finished treehouse nestled among three living trees.

"Everybody thought we were crazy [at] the beginning, like 'What are you guys doing building a treehouse here?' Our parents thought we were crazy," says Kati.

But the hard work and vision paid off, and now visitors from all over the world routinely come to stay at their carefully crafted work of art. The 700-square-foot treehouse features a master suite with a deck that overlooks the forest, a living area with three benches that can double as sleeping quarters, and two bathrooms. Guests can also prepare a meal in the treehouse's downstairs kitchen, complete with a refrigerator, a stove, a sink and a dishwasher.

"There’s even air conditioning in this treehouse, because we wanted to create a very luxury experience here. I have to be honest - the treehouse is nicer inside than the house that I live in, so I like to come back here and just have a little retreat away from it all," says Kati.

Every detail of the treehouse was painstakingly thought out, and most of the materials were either sourced locally or repurposed. The trim and the interior feature wood that Darin himself milled, sanded and finished, and the breakfast table nook was made from the base of a tree located right on their property.

One of Kati's favorite details of the treehouse, however, is the spiraling exterior staircase, which is wrapped around a large tree shipped in from Darin's grandmother's yard, roots and all.

Although Darin handled most of the heavy-duty construction of the structure, Kati's handiwork is all over the interior.

"We wanted it to be kind of funky and modern - but still have some Montana accents and still be a little rustic too. So there were many things coming into play, and we wanted people to feel like it was a very cozy home away from home when they came here, and just like a one-of-a-kind Montana experience," she says.

A combination of white shiplap and multicolored wood paneling covers the interior walls, giving the home an eclectic yet polished farmhouse look, and expansive windows create an open, airy feeling in the small living spaces. Modern elements that are dotted throughout the house, like the industrial chandelier in the kitchen and the black hexagon and subway tiles in the bathrooms, are more reminiscent of a boutique hotel than a remote treehouse located near Glacier National Park.

Close to Kati's heart are the pieces by local artists that don the walls, with some of the pieces coming from guests who created the artwork while staying at the treehouse.

"It’s been really cool to see [how] this place inspires people," she says.

But the defining characteristic of this home - and what guests travel miles for - is the unique experience of living out your childhood dreams of sleeping in a treehouse.

"It’s a very unique feeling that most people have never experienced, to be lying in bed and seeing a tree - or you’re actually moving. And people have told me that they love the experience, and it’s - yeah, it’s a treehouse. That’s the beauty. It’s a real treehouse," says Kati.

Related:


via This Stylish Treehouse Is Luxury Off-the-Grid Living

802,555 Homes at Risk of 10-Year Flood Inundation by 2050

  • Unchecked greenhouse gas emissions would put 3.4 million existing homes worth $1.75 trillion at risk of inundation from a 10-year flood by 2100.
  • By 2050, those figures are 802,555 homes worth $451 billion – and 19,250 of those homes were built after 2009. New York, Tampa, Virginia Beach and 21 other cities built at least 100 homes in the risk zone during that time.
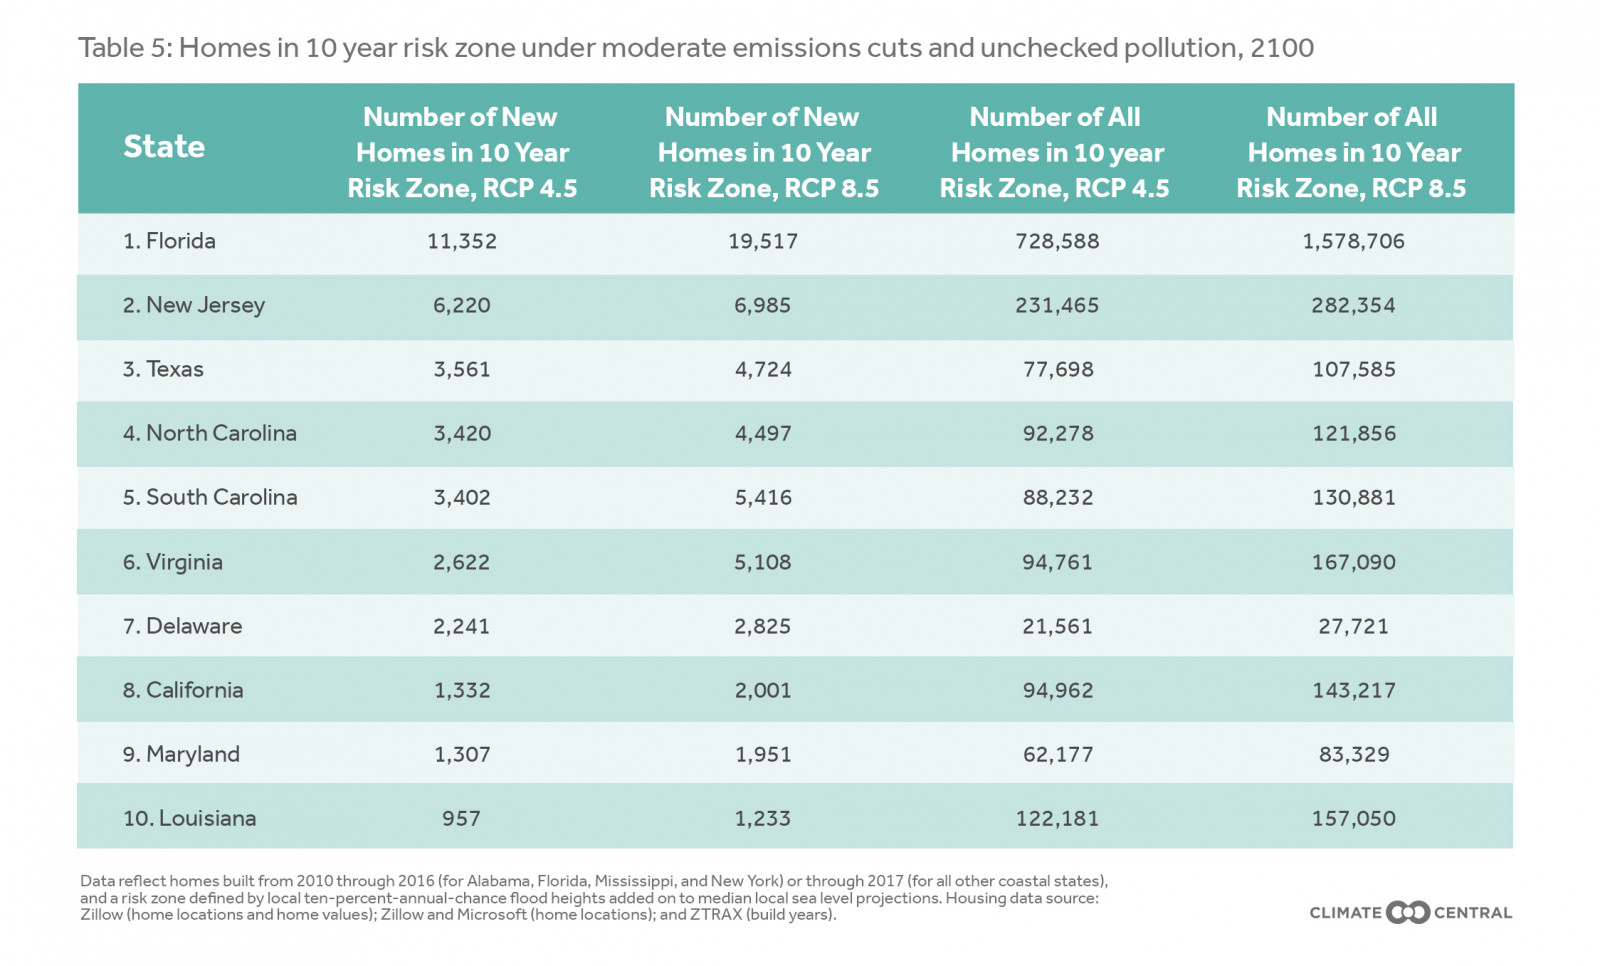
  • Florida would have the most homes at risk (1.58 million) by 2100, followed by New Jersey (282,354), Virginia (167,090), Louisiana (157,050) and California (143,217)-assuming levees and other infrastructure defenses hold.

In 2012, Hurricane Sandy slammed into New Jersey, producing a major storm surge and damaging or destroying many thousands of homes. In the years that followed, builders put up new houses and reconstructed damaged ones - in many areas that will be vulnerable to more flooding in the future.

The post-Sandy rebuilding was a striking example of a broader pattern. Across the United States, coastal communities have recently built tens of thousands of houses in areas at risk of future flooding driven by sea-level rise from climate change. That has put homeowners, renters, and investors in danger of steep personal and financial losses in the years ahead.

In 2018, Climate Central and Zillow produced the first nationwide analysis of the number of new homes in areas vulnerable to coastal flooding in all 24 coastal states and the District of Columbia. The research projected how many homes will become exposed to on-average annual ocean flooding in the coming decades - depending on what choices the world makes around greenhouse-gas pollution today. This report improves those results by incorporating full home footprint data instead of point location estimates (see methodology), and also provides results for bigger floods in addition to the annual ones.

The results are clear. If the world makes moderate cuts to greenhouse-gas pollution - roughly in line with the Paris agreement on climate, whose targets the international community is not on track to meet - some 17,800 existing homes built after 2009 will, by the year 2050, risk inundation by a 10-year flood. The figures for 2100 are more than two times higher - and more than three times higher if pollution grows unchecked.

Over the past decade, public interest in sea level rise has grown, tidal flooding has increased in many coastal communities, and global attention has coalesced around the dangers of climate change in international negotiations in Copenhagen and Paris. And yet in the years after the 2009 Copenhagen meeting, a third of the country's coastal states experienced a higher rate of new home building in areas at risk of 10-year floods than in areas not at risk.

Location, location, inundation

By boosting the average water height, sea level rise is projected to make the kinds of intermittent floods that coastal communities see on average once a decade - meaning there's a 10% annual risk of this type of devastating flood- reach farther inland than they do today. Those floods can damage and devalue homes, degrade infrastructure, wash out beaches, rust out car underbodies, promote mold, and more.

Future emissions will shape the extent of those harms - and the number of homes in each coastal region's "risk zone" - in the years ahead. Unless otherwise noted, this report defines the risk zone as the area exposed to a 10-year flood threat in 2050, under the moderate emissions cuts known technically as Representative Concentration Pathway (RCP) 4.5, and under the median projections for sea-level rise corresponding to this emissions level as described in Kopp et al. 2017.[1] Other risk zones can be defined with other assumptions, such as unchecked emissions, or by looking to the year 2100, and yield different results. "New homes" refers only to currently existing structures built after 2009 and before 2017 (or before 2016 in Alabama, Florida, Mississippi and New York). "New" does not refer to homes that will be built in the future.

New homes in risk zones are not evenly distributed across the country's coastal states. Local factors, from the size of the population and the condition of the economy to the amount of space available, shape the development of new housing stock in each community. And the size of a risk zone is itself the product of a variety of elements, from land elevation to the presence of protective features such as levees.

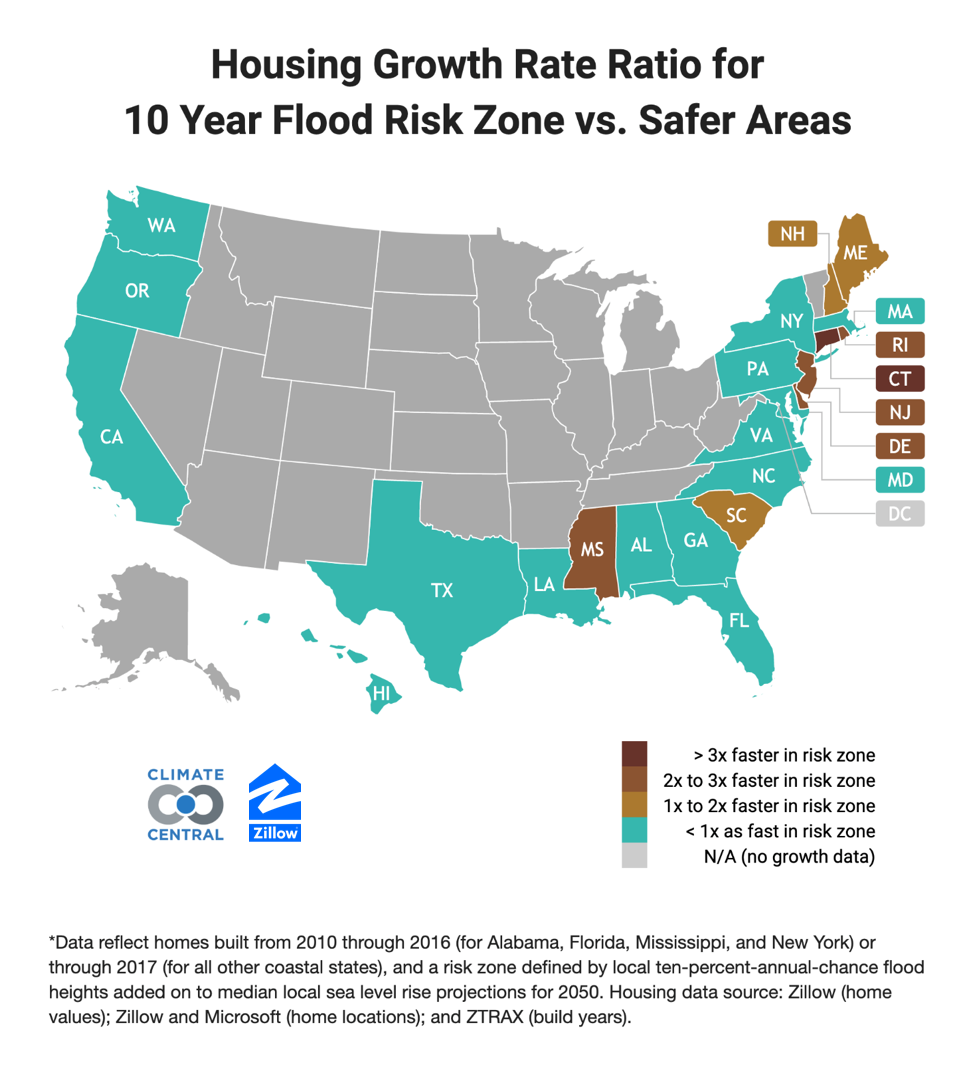
Fairly comparing the pattern of new construction in risk zones across different cities, states or counties requires tracking more than just raw numbers. For this analysis, we compared percentage growth in housing within the flood-risk zone with percentage growth outside of it, producing a single, comparable ratio for each place.

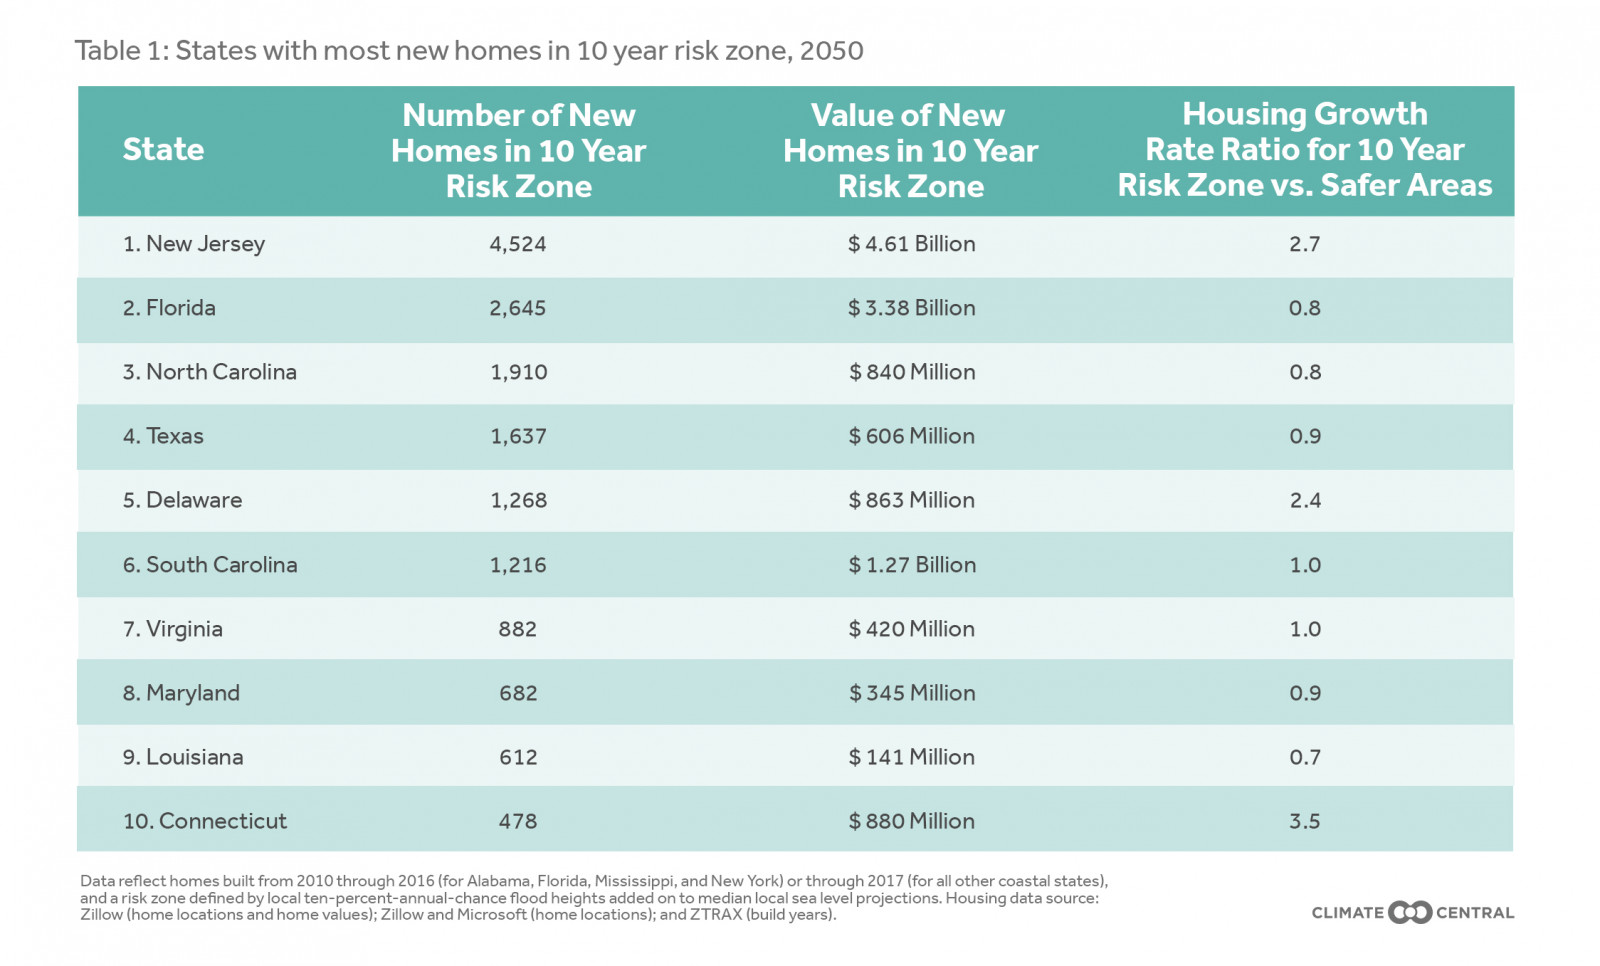
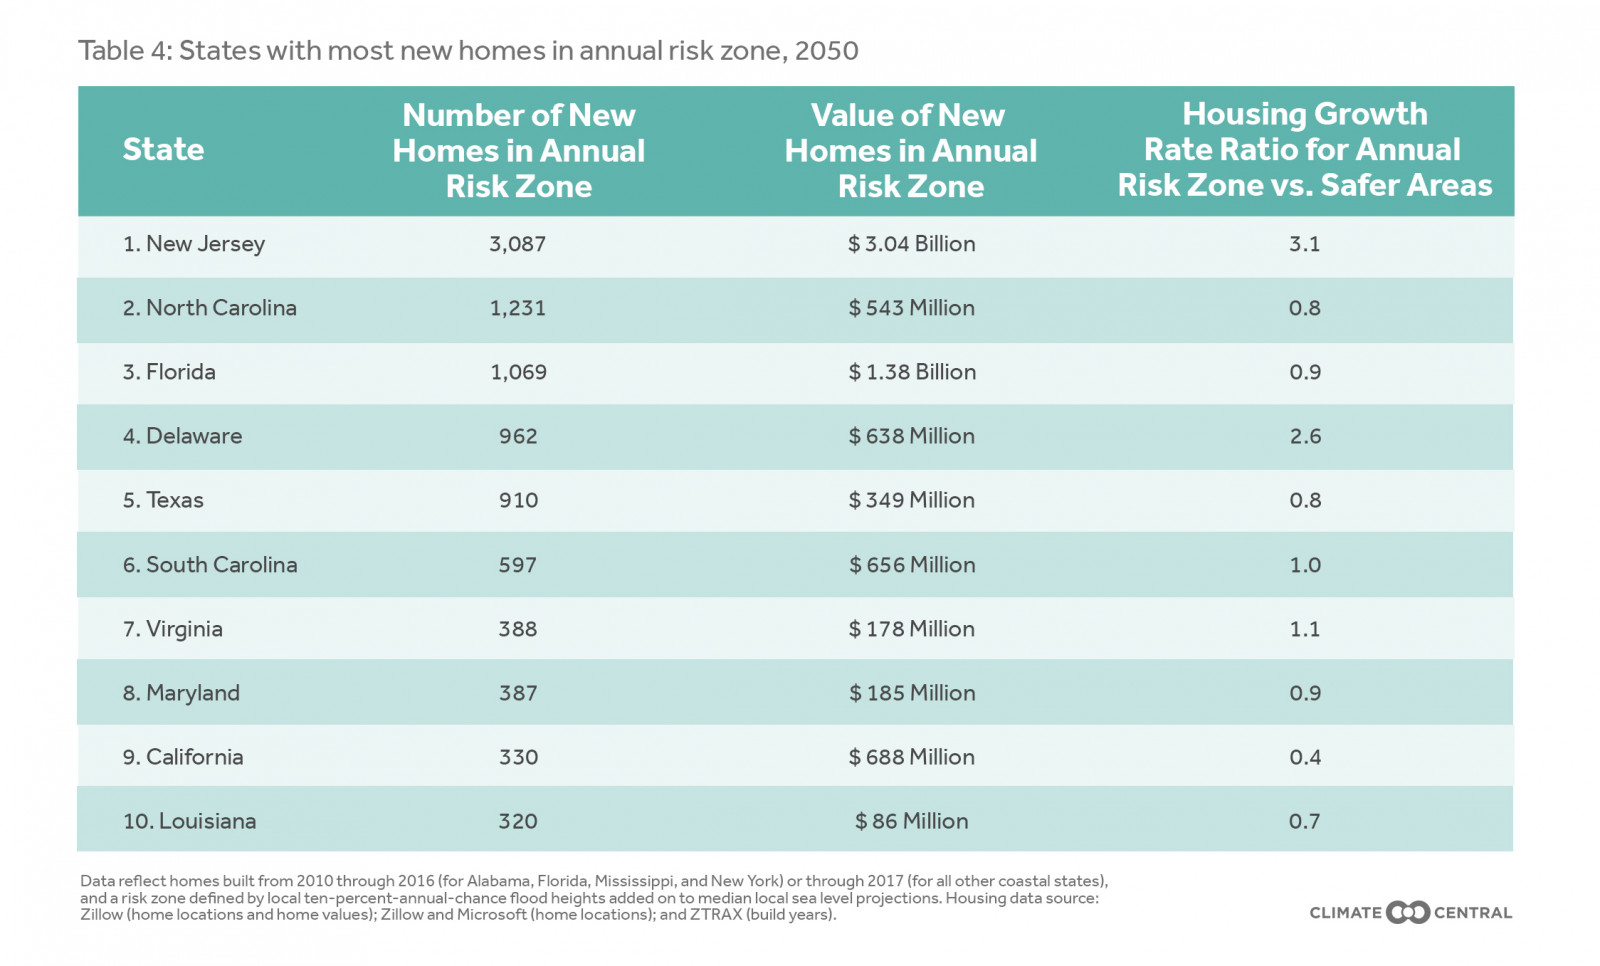
Take the state of New Jersey. After 2009, the housing growth rate was nearly three times higher in the coastal flood risk zone than in safer areas. Around 4,500 new homes, worth some $4.6 billion, were added in the flood-risk zone after that year - most likely driven by reconstruction following Hurricane Sandy. In Connecticut, meanwhile, the ratio of risky growth to less risky growth was even higher, at around 3.5 times. And in Florida, where the recent risk zone growth rate has lagged the growth rate in safer areas, some 2,645 newly built homes are nevertheless in locations at risk of flooding at least once each decade by 2050.

Six other coastal states likewise saw their construction growth rates in the risk zone outpace growth rates in safer areas. (In addition to the states listed in Table 1, these include Maine, Mississippi, New Hampshire, and Rhode Island.) A third of the country's coastal states, in other words, have recently seen higher housing growth rates inside the 10-year flood-risk zone than outside it.

Counties and cities

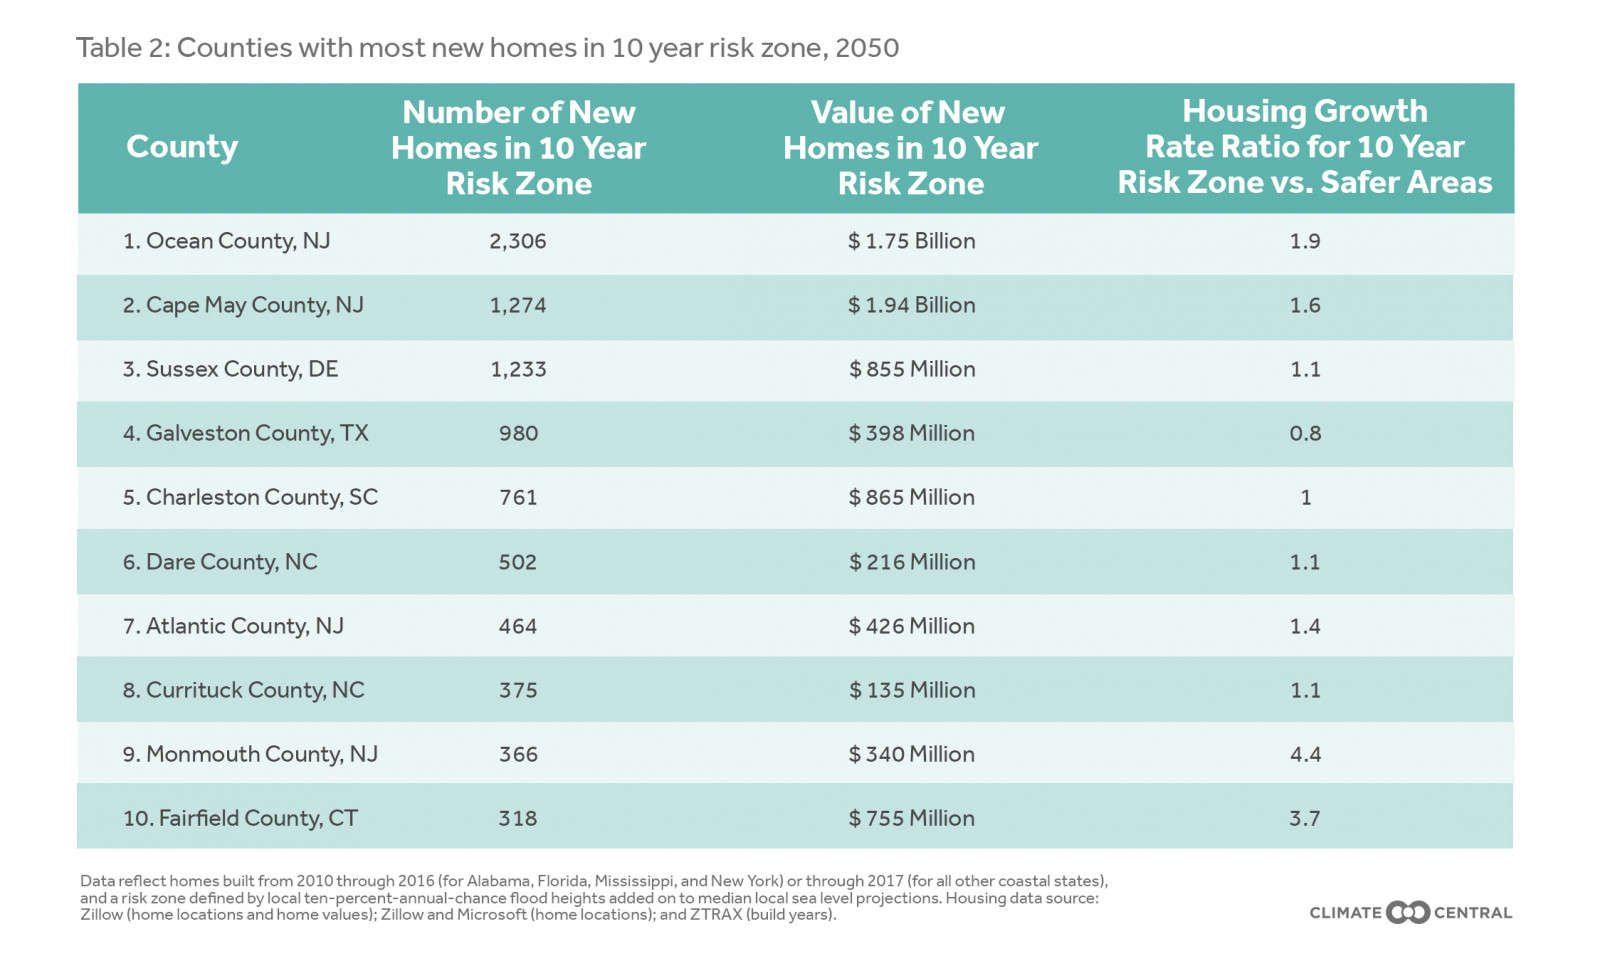
Just as the growth in new risk-zone housing is unevenly distributed across states, so it is unevenly distributed within them. There are 37 counties where more than 100 at-risk homes were built after 2009. All those counties are in 12 states: Connecticut, Delaware, Florida, Louisiana, Maryland, Mississippi, North Carolina, New Jersey, New York, South Carolina, Texas, and Virginia.

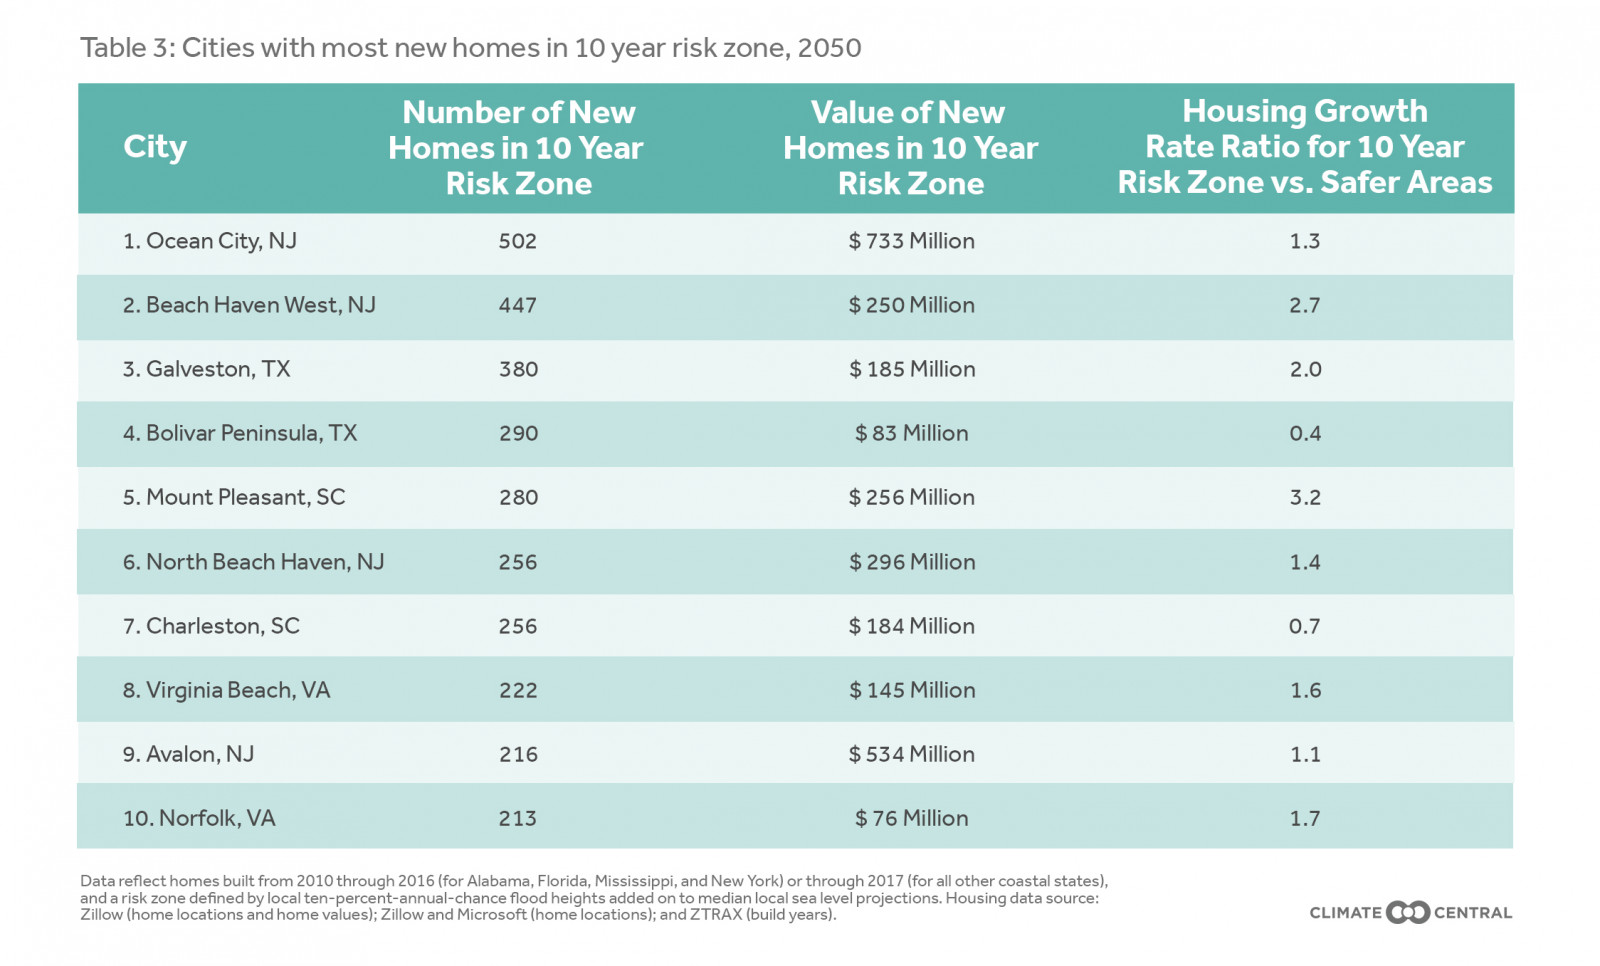
In 24 cities, at least 100 homes were built in the risk zone after 2009. None built more than Ocean City, N.J., a popular resort town in Cape May County, which put up some 500 new houses in the risk zone.

The larger cities of New York City, Tampa, and Virginia Beach also rank among the cities with more than 100 new homes in areas of future 10-year flood risk.

Flooding the market

This report has so far focused only on the 10-year flood zone. But it is also possible to look at annual floods, occurring on average once per year - less extreme events that inundate less land than do decadal floods, but on a more frequent basis.

Overall, some 10,500 newly built homes are on land that will lie within the annual flood zone by 2050 - some 7,000 fewer than will lie in the 10-year flood zone. In New Jersey alone, about 3,100 will lie in the annual flood zone by 2050.

What's more, pollution scenarios beyond the moderate emissions cuts described in this report are possible. Instead of making the kinds of moderate emissions reductions pledged in Paris, the world might achieve deep cuts. Alternatively, humanity could pour greenhouse gases into the atmosphere unchecked.

How would these alternatives affect the 10-year flood risk to recently built U.S. homes? By 2050, not a lot. Moderate cuts to pollution would leave just over 17,800 new homes in the risk zone. Deep cuts in emissions - what the Intergovernmental Panel on Climate Change calls RCP 2.6 - would trim that figure to about 17,250. And unchecked pollution, or RCP 8.5, would place 19,250 homes in areas in danger of flooding at least once per decade, on average.

By the end of the century, however, there will be significant differences in the dangers that these emissions scenarios pose for coastal homes. Deep cuts would leave about 27,750 recently built homes at risk. Moderate reductions akin to those pledged in the Paris agreement would boost that number to 40,800. If greenhouse-gas pollution rises unchecked, 60,500 of today's new homes would lie in the ten-year flood-risk zone by 2100.

More striking still is that those 60,500 just-built homes would represent a tiny fraction of the total number of homes at flood risk. Unchecked pollution would give each of 3.4 million existing homes a risk of inundation by a 10-year flood by 2100. That figure is 802,555 homes by 2050. Those properties are currently worth some $1.75 trillion - an amount equal to about nine percent of the U.S. economy.

No state has more to lose from such an outcome than Florida, where about 8,150 more new homes are projected to be in the flood-risk zone by century's end if greenhouse-gas pollution continues unabated than if moderate cuts are achieved. When all home vintages in the state are considered, the difference is even starker. Unchecked pollution would put about 850,000 more Florida homes in flood-risk zones than would moderate cuts - and 1.2 million more than deep cuts.

Methodology

Sea level and flood projections

This analysis determines the maximum local land elevations that define risk zones by projecting future local sea levels and adding the height above sea level that local floods exceed on average once per year.

Local sea level projections are based on a recent peer-reviewed research paper (Kopp et al. 2017)[1] building off of global projections from the Intergovernmental Panel on Climate Change and emerging research on the potential instability of Antarctic ice sheets (DeConto and Pollard 2016)[2], which could lead to significantly more sea level rise in the second half of the century. Climate pollution scenarios modeled include "unchecked pollution" (technically, Representative Concentration Pathway 8.5, or RCP 8.5), "moderate carbon cuts" (RCP 4.5), and "deep carbon cuts" (RCP 2.6), this last choice meaning a peak in emissions near the year 2020 followed by a sharp decline to zero near 2070 and then by net negative emissions. The sea level model was run for thousands of simulations given each scenario. Median projections under each scenario for the years 2050 and 2100 are used, reflecting mid-range sea level sensitivity to climate pollution. Lesser or more severe outcomes are possible, with 5th and 95th percentile results available in the Risk Finder tool (scroll to the "Future Flood Risk to Homes" section of the tool after typing a city, county, or state name, and click on the gear-shaped settings icon at the top right of the panel).

Levels for annual average and decadal floods were derived using methods from Tebaldi et al. 2012[3], with water level station data updated through the end of 2015 for 71 stations around the United States. This approach assumes no future changes in the frequency or severity of coastal storms or tides, as compared to past decades. Some research indicates climate change will worsen future storms. Storm surge associated with major hurricanes has already been increasing over the last century.

Defining risk zones

"Risk zones" are first classified as areas with elevations below local projected sea levels plus annual or decadal flood heights. Assessment is based on accurate, high-resolution, lidar-derived elevation data provided principally by the National Atmospheric and Oceanic Administration (NOAA). Initial risk zones are then refined by removing low-lying areas that appear to be protected from the ocean by natural topography or by levees. This approach is called using a "bathtub model," since it relies only on how still water would fill a landscape, like water filling a tub, without accounting for factors such as wind, waves, or rain that give actual floods dynamic and uneven surfaces. Bathtub models are appropriate for mapping pure sea level projections, and make reasonable approximations for more modest floods, such as average annual or decadal ones.

Dynamics play a larger role in rarer and more violent storms, such as "hundred-year floods," so bathtubs are less appropriate for these. More sophisticated methods using hydrodynamic simulations can take many factors into account that bathtub models cannot, but require large amounts of computing power to characterize well the thousands of combinations of sea level, tides, wind, waves, and rain that any location might experience in the future.

Levees, walls, dams, or other features may protect some areas, especially at lower elevations. Data limitations, such as an incomplete inventory of levees and a lack of levee height data, make assessing the protection afforded by levees difficult. Levees are particularly prevalent in Louisiana and in the Bay Area and San Joaquin delta region of Northern California. Missing or mischaracterized levee data in these areas may have important effects on results, including known overestimates of exposure due to missing levee data in Northern California. We use data from the FEMA/USACE Midterm Levee Inventory for our national flood control structure dataset, and supplement this with local data from Louisiana and Massachusetts. This analysis does not account for future erosion, marsh migration, or construction. As is general best practice, local detail should be verified with a site visit.

We assume for purposes of this analysis that levees are always high and strong enough for flood protection. However, the American Society of Civil Engineers rated only eight percent of monitored levees as in "acceptable" condition, and some areas and assets that appear to be protected by levees, ridges, or other features may not actually be protected. Areas may have hidden connections through porous bedrock geology, as is common in South Florida, another area with plentiful levees that line drainage channels and canals. Low-lying areas may also be connected by channels, breaks in levees or seawalls, or drainage passages that are not captured by the elevation data, such as sewers. There is further no guarantee that existing levees will be maintained through 2050 or 2100. On the other hand, new defenses could also be built within these timeframes.

Housing data

Homes whose geographic coordinates lie within or outside of risk zones were separately counted and their values, which were estimated by Zillow, were summed. Zillow provided location, value data (Zestimates), and build years for homes built through 2016 (for Alabama, Florida, Mississippi, and New York) or 2017 (for all other coastal states). Separate tallies were made for homes built in 2010 or later, versus 2009 or earlier. The data do not include build year for some homes; these homes were included in analyses for all homes. Only homes with known build year were included in calculations of housing growth rate, which was computed as homes built in 2010 or later, divided by homes built in 2009 or earlier.

Geographic coordinates of homes within the Zillow database may also contain errors, especially in low-density rural areas. However, we have empirically found such errors to be virtually random with nearly zero bias, so exposure totals aggregated to larger administrative boundaries, such as cities and counties, are expected to accurately reflect actual vulnerability.

For our 2019 update, Zillow data were further refined using Microsoft’s U.S. Building Footprints database (accessed via a Creative Commons Attribution 4.0 International Public License). If any part of a building was lower than a flood's height, then the entire structure was considered vulnerable. For each building footprint, we determined the lowest land elevation within it. We then associated each home's point coordinates, from the Zillow database, to its closest building footprint, and assigned the structure its corresponding elevation. 

Zillow property and Zestimate data were refined to ensure a set of unique properties with complete addresses and home valuations (Zestimates). Zillow data include single-family homes, condominiums, and other homes in multi-unit properties, such as duplexes and triplexes - in other words, units where the tax parcel is a single dwelling unit. Buildings zoned for commercial residential use, such as apartment buildings, are not included, and so total housing counts using these data are generally lower than corresponding estimates using the 2010 census.

Address and built year data were provided by Zillow through the Zillow Transaction and Assessment Dataset (ZTRAX). More information on accessing the data can be found at http://www.zillow.com/ztrax. Proprietary Zillow data, such as Zestimates, were provided under strict confidentiality.


[1] Kopp, R. E., DeConto, R. M., Bader, D. A., Hay, C. C., Horton, R. M., Kulp, S. , Oppenheimer, M. , Pollard, D. and Strauss, B. H. (2017), Evolving Understanding of Antarctic Ice‐Sheet Physics and Ambiguity in Probabilistic Sea‐Level Projections. Earth’s Future, 5: 1217-1233. doi:10.1002/2017EF000663

[2] DeConto, Robert M., and David Pollard. “Contribution of Antarctica to past and future sea-level rise.” Nature 531.7596 (2016): 591.

[3] Tebaldi, Claudia, Benjamin H. Strauss, and Chris E. Zervas. “Modelling sea level rise impacts on storm surges along US coasts.” Environmental Research Letters 7.1 (2012): 014032.


[1] Kopp, R. E., DeConto, R. M., Bader, D. A., Hay, C. C., Horton, R. M., Kulp, S., Oppenheimer, M., Pollard, D., & Strauss, B. H. (2017). "Evolving Understanding of Antarctic Ice-Sheet Physics and Ambiguity in Probabilistic Sea-Level Projections." Earth's Future, 5, 1217–1233, https://ift.tt/2BVVXfj


The post 802,555 Homes at Risk of 10-Year Flood Inundation by 2050 appeared first on Zillow Research.


via 802,555 Homes at Risk of 10-Year Flood Inundation by 2050

America’s 10 Hottest Neighborhoods, 2019 Edition

Tuesday, July 30, 2019

Almost Half a Million California Homes at Risk From Wildfires

Nearly half a million homes in California risk being in the path of wildfires, according to an analysis that combines U.S. Forest Service data with Zillow housing data. The Forest Service risk map specifically depicts the potential for wildfires that would be difficult to contain.

In California, there are 477,039 homes worth $268.2 billion in areas deemed to have "high" and "very high" wildfire hazard potential. The average value of those homes is more than $550,000, including the land.


Zooming into the metro level, Zillow analyzed the wildfire risk to homes in four areas: Los Angeles, Riverside, San Diego and Sacramento. 

Among those four, Riverside has the most at-risk homes — 113,520 — while the homes at risk in the Los Angeles area have by far the highest average value at more than $1 million.

Federal officials have warned that this year's fire season could be worse than in 2018, when more than 80 people were killed and tens of thousands of structures were burned. The cost of wildfires in 2018 alone was more than $24 billion.

Metro area Homes in
very high risk areas
Home in
high risk areas
Value of homes in very high risk areas Value of homes in high risk areas % homes in
very high risk areas
% homes in
high risk areas
Sacramento 11,306 43,652 $5.2 billion $21.9 billion 1.7% 6.5%
Riverside 26,254 87,266 $9.2 billion $31.4 billion 2.1% 7.1%
Los Angeles 6,765 20,974 $9.2 billion $21.7 billion 0.2% 0.8%
San Diego 8,472 33,267 $5 billion $22.1 billon 1.0% 4.1%
California 134,428 342,611 $76.7 billion $191.5 billion 1.4% 3.5%


The post Almost Half a Million California Homes at Risk From Wildfires appeared first on Zillow Research.


via Almost Half a Million California Homes at Risk From Wildfires

May Case-Shiller Results and June Forecast: Still Tapping on the Brakes

  • Home prices were up 3.4% year-over-year in May, a slowdown from 3.5% the previous month.
  • The 10-city composite rose 2.2% from last year, and the 20-city composite climbed 2.4% year-over-year.
  • Las Vegas, Phoenix and Tampa posted the largest year-over-year gains among the 20 cities, growing 6.4%, 5.7% and 5.1% respectively.

Home prices continue to climb, but at a slower pace that amounts to normalization rather than full cooling. In May, which is well into home-buying season, prices slowed again, , according to Case-Shiller’s national home price index. They rose 3.4% year-over-year, below 3.5% growth in April, which itself marked a slowdown from March.

Only seven of the cities in Case-Shiller’s 20-city composite reported higher price increases for the year ending May 2019 compared to April 2019. Las Vegas, Phoenix and Tampa posted the largest year-over-year gains in that group, climbing 6.4%, 5.7% and 5.1% respectively. Seattle, which used to report white-hot price growth, fell by 1.2% year-over year. San Francisco gained just 1%.

Index Zillow Forecast, Released 6/25/19 Actual Case-Shiller Indices,
Released 7/29/19
Historical Median Absolute Error*
10-City Composite,
Month-Over-Month (SA)
0.0% 0.1% 0.2%
10-City Composite,
Year-Over-Year (NSA)
2.2% 2.2% 0.2%
20-City Composite,
Month-Over-Month (SA)
0.0% 0.1% 0.2%
20-City Composite,
Year-Over-Year (NSA)
2.4% 2.4% 0.1%
U.S. National
Month-Over-Month (SA)
0.2% 0.2% 0.1%
U.S. National
Year-Over-Year (NSA)
3.5% 3.4% 0.1%
*Calculation of Median Absolute Errors are based on Zillow’s monthly Case-Shiller forecasts. Zillow’s Case-Shiller 10- and 20-City Index forecasts date to 2011.  The national Case-Shiller forecasts began in 2014.


Thwarted by climbing prices for years, buyers are no longer willing to pay any price. There were too few homes on the market and buyers were unable to find houses that fit both their needs and their budgets, so they took a breather. The fact that buyers – and prices – slowed their roll right through the middle of home-buying season indicates just how few homes are on the market.

Low mortgage rates and consumer demand typically would create a bonanza for builders and the housing market overall. In recent years, builders have faced high land and labor costs that prevented them from putting up homes fast enough, particularly at the less expensive end of the market where first-time buyers search.


Index Actual May
Case-Shiller Change
Zillow’s June
Case-Shiller Forecast
10-City Composite,
Month-Over-Month (SA)
0.1% -0.1%
10-City Composite,
Year-Over-Year (NSA)
2.2% 2.0%
20-City Composite,
Month-Over-Month (SA)
0.1% 0.0%
20-City Composite,
Year-Over-Year (NSA)
2.4% 2.2%
U.S. National
Month-Over-Month (SA)
0.2% 0.2%
U.S. National
Year-Over-Year (NSA)
3.4% 3.4%
*Calculation of Median Absolute Errors are based on Zillow’s monthly Case-Shiller forecasts. Zillow’s Case-Shiller 10- and 20-City Index forecasts date to 2011.  The national Case-Shiller forecasts began in 2014.

The post May Case-Shiller Results and June Forecast: Still Tapping on the Brakes appeared first on Zillow Research.


via May Case-Shiller Results and June Forecast: Still Tapping on the Brakes

Should you pay off your Mortgage Before Retirement?

Should you pay off your Mortgage Before Retirement?  How do you decide what’s more important financially, paying off your mortgage before retirement, or saving as much as you can for retirement? Unfortunately, there’s no simple answer to this question. Everyone’s finances and goals are different and that means so is their path toward the perfect … Continued The post Should you pay off your Mortgage Before Retirement? appeared first on Barrington Acquisitions.
Source: Should you pay off your Mortgage Before Retirement?

How to spot a walkable neighborhood

Disco Inferno! Dance On Into These 12 Homes With Private Discos

Monday, July 29, 2019

Top 10 Affordable Lake Towns, 2019: Splashy Waterfront Retreats for Cheap!

Friday, July 26, 2019

A Fascinating Peek Inside Frank Lloyd Wright’s ‘Playhouse’: Can You Spot What’s Fake?

Falling Home Prices Do Not Always Accompany Recessions

  • In the housing-led Great Recession, home values fell significantly across the country. But during the tech bust recession of 2001, home values broadly continued to rise faster than inflation.
  • Outside these two national recessions, several states have had slowdowns similar to national recessions, during which home value growth stayed positive.

As U.S. economic growth slows, many market observers worry about a reprise of the housing bust that accompanied the Great Recession. While it is true that housing and the broader economy are linked, there is good reason to doubt that we will see another collapse in prices for the housing market. Evidence from other recessions in the last 23 years shows that it is perfectly possible for the country, and individual states, to go into recessions without accompanying drops in home values.

There have only been two national recessions in the time frame covered by Zillow's home value data: the dot-com bust from March to November 2001, and the Great Recession from December 2007 to June 2009, as dated by National Bureau of Economic Research. Outside these time frames, however, some isolated parts of the country experienced slowdowns in economic activity.

Several states with large energy sectors experienced the local equivalent of recessions when oil prices fell dramatically. In particular, Alaska, Louisiana, North Dakota, Oklahoma, and Wyoming each fell into recession starting in 2015, for durations ranging from about half a year to 1.5 years. But home values did not fall in any of these states at any point in their localized recessions; in fact, annual home value growth averaged 4.3%, compared to 5.2% average growth in states that experienced economic expansion in 2015 and 2016.

Home values did fall broadly across the country during the Great Recession. Out of 950 state-month observations from December 2007 to June 2009, only 203, or 21%, showed positive state-level home value growth; only 68, or 7%, had state-level home value growth higher than 2%, the long-run inflation target of the Federal Reserve.

However, in the 1,039 state-month observations of other recessions since 1997, either the dot-com bust or individual state-level recessions, home value appreciation was positive 81% of the time — and 74% of the time, it was above 2%. This was nearly identical to the rates of home value appreciation for state-months in economic expansion, of which 81% saw positive growth in home values, and 70% had appreciation greater than 2%.

That means home values were positive just as often during the dot-com bust and the state-level recessions as during economic good times. One caveat to these figures is that the prolonged housing bust both preceded and outlasted the technical duration of the Great Recession, so while some of those negative months of home value change are being accurately counted as expansionary months, it's clear that they are related to the Great Recession.

Generally, home value appreciation averaged 4.6% in state-months experiencing economic expansion; slightly lower at 4% in recessionary periods outside the Great Recession; and negative 4.6% during the Great Recession.

The bottom line: Falling home prices have not always accompanied recessions in the 21st century.

Methodology

We estimated state-level recessions using the Bry-Boschan method outlined by Jason Brown of the Kansas City Federal Reserve Bank, which uses monthly State Coincident Indexes published by the Federal Reserve Bank of Philadelphia. Brown specifies a minimum business cycle of 24 months with a minimum phase of six months. In this analysis, we allow for a minimum business cycle of 12 months and maintain the six-month threshold for each phase of the business cycle.

We then merged these state-level recession estimates with Zillow Home Value Indexes at the state-month level to assess what has historically happened to home values during state-level recessions.

The post Falling Home Prices Do Not Always Accompany Recessions appeared first on Zillow Research.


via Falling Home Prices Do Not Always Accompany Recessions

Need to Relocate? Bring The House, Too

Farm Turned Rustic-Chic Wedding Venue Is the Week’s Most Popular Home

Thursday, July 25, 2019

This City Has the No. 1 Most Stable Housing Market in the Country

Under-35 Bracket Roars Back (Q2 2019 U.S. Homeownership Rate)

Homeownership rates repeated the declines of the previous quarter, albeit less dramatically. The declines we’ve seen in recent quarters are erasing gains we started to see in 2016. The continued decline was more dramatic in older age brackets. In a surprising turn, while their older peers have apparently been pulling back, the homeownership rate in the under-35 age bracket increased.

This goes against the abrupt slowdown in home value appreciation in the entry-level market: As home values exploded over 2017 and 2018, incomes were dwarfed. By 2019, some buyers simply couldn’t save enough for a down payment and pulled back from the market, causing sales and home value appreciation to slow dramatically. Given the affordability challenge of saving for that down payment, this could be a testament to the ambition of younger households to break into homeownership.

While last quarter the Hispanic homeownership rate was the most stalwart — the only racial/ethnic group to see increases — this quarter erased all those gains.

As buyers pull back from the for-sale market, they’re remaining in rental markets for longer. All that recent apartment building, while taking off the pressure within principal cities (building was generally concentrated downtown), it still wasn’t enough to help renters in the suburbs and more rural areas, where rental construction has been missing.

The post Under-35 Bracket Roars Back (Q2 2019 U.S. Homeownership Rate) appeared first on Zillow Research.


via Under-35 Bracket Roars Back (Q2 2019 U.S. Homeownership Rate)

Most Expensive Listing: $50M Manhattan Mansion That Was Once Home to Gloria Vanderbilt

Why the Next Recession Is Likely to Happen in 2020, and What It Will Mean for Housing

  • Exactly half of a panel of more than 100 real estate and economic experts said they expect the next recession to begin in 2020, with another third (35%) predicting the next recession to begin in 2021.
  • Trade policy, a geopolitical crisis and/or a stock market correction were the factors identified by panelists as most likely to trigger the next recession. A housing slowdown is unlikely to cause the next recession, according to the panel, but home buying demand is expected to fall next year.

The longest uninterrupted economic expansion in U.S. history will probably end with a recession in 2020, according to a panel of more than 100 experts.[1] Trade policy, a stock market correction and a geopolitical crisis were cited as the most likely triggers for the next economic reversal.

The current expansion recently broke the previous record-long streak of 120 months, set between 1991 and 2001. If the currently hot U.S. economy does slide into a recession next year, it will be doing so amidst softening home buying demand that is expected to be lower in a year than it is now.

The Q2 2019 Zillow Home Price Expectations survey, sponsored by Zillow and conducted quarterly by Pulsenomics, asked more than 100 real estate experts, economists and strategists for their views on the timing of the next recession and the evolution of home buying demand this year and next. Among those with an opinion, exactly half (50%) said they expected the next recession to begin at some point in 2020, with another 35% saying they expected the current expansion to end in 2021.

Almost one in five panelists (19%) said the next recession would begin in Q3 2020, the most popular quarterly choice, and 9% said the next recession was most likely in Q3 or Q4 of this year. Just 1% of those with an opinion said they expected the next recession would not begin until 2023, with another 1% saying it would happen after 2023.

The expected timing of the next recession was largely in line with expectations this panel expressed around the same time last year, when 48% of panelists said they expected the next recession to begin in 2020.

Housing Won't Cause the Next Recession, But Will Be Impacted

Panelists were asked to choose and rank up to three economic and/or political factors likely to trigger the next recession, from a list of 10. Trade policy, a geopolitical crisis and a stock market correction were the most commonly chosen factors, respectively. A housing slowdown was among the factors rated as least likely to cause the next recession, chosen by just one in eight (12.6%) panelists that offered an opinion.

But while panelists largely indicated a housing slowdown was unlikely to cause the next recession, the housing market will surely be affected by more sluggish economic conditions. A small majority (51%) of those experts with an opinion said they expect home buying demand in 2020 – when they say a recession is most likely to occur – to be somewhat or significantly lower than in 2019. About a third (32%) said they expected home buying demand to be about the same in 2020 as in 2019.

More immediately, almost three quarters of respondents (73%) said they expected home buying demand this year to be about the same or lower than last year. Home sales have been sluggish to start 2019 compared to the beginning of 2018, despite conditions that are more favorable for buyers now than they have been in quite some time.

Weakening Demand, Slowing Home Value Growth

Put together, signs of already fading demand and the possibility of an impending recession are also very likely to contribute to further slowdowns in overall U.S. home value appreciation going forward. Currently (April 2019), U.S. median home values are growing at a 6.1 percent annual pace – strong by historic standards, but well below annual appreciation rates of 8.1 percent recorded as recently as December. Annual home value growth has slowed in each of the past four months compared to the month prior, and panelists said they expect this slowdown to continue.

Panelists were asked for their opinions on the pace of home value growth over the next five years. On average, panelists said they expect annual growth at the end of 2019 to be 4.1 percent, slowing further to 2.8 percent in 2020 and 2.5 percent in 2021 before picking up somewhat in 2022 and 2023 (to 3 percent and 3.4 percent, respectively).


[1] Of 112 panelists who participated in this edition of the survey, 98 responded to this question. Excluding indeterminate responses, a plurality of one-half (50%) of the experts expect the next recession to begin sometime in 2020.

The post Why the Next Recession Is Likely to Happen in 2020, and What It Will Mean for Housing appeared first on Zillow Research.


via Why the Next Recession Is Likely to Happen in 2020, and What It Will Mean for Housing

Wednesday, July 24, 2019

Most popular homes and their neighborhoods of July 2019

This School Bus Is a Tiny Home ... to a Family of 6!

Van? RV? School Bus? 6 Questions to Ask Before Choosing a Home on Wheels

We've all seen photos of the perfectly manicured home on wheels: the reclaimed wood-lined walls, the occupants dreamily sipping coffee and watching a sunrise. People of all ages (including me) are asking themselves, "Can I do that too?" 

When I first saw the van that would one day be mine, I thought it was perfect for me. The 1986 GMC Vandura had a comfy bed, turquoise cabinets and twinkle lights that made me weak in the knees.

But a mobile life can involve just as much work as a stationary one - sometimes even more. You won't have to pay a mortgage, but you might need new brakes. You won't have to rely on neighbors to water your plants when you travel, but you will have to keep a tiny space organized and livable on the road.

If those things don’t scare you off, the rewards can far outweigh the work. Here are some important questions to consider first.

Which home is right for you?

There are various names for homes on wheels and recreational vehicles.

The RV is a self-contained, manufactured home on wheels. It typically contains a bathroom and a kitchen, and depending on the version you choose, it can be driven or towed. If you own a vehicle with towing capacity, a towable RV allows you to park and move around more freely.

Camper vans are more compact but offer fewer amenities. They might have a small kitchenette but rarely contain a bathroom. If you're willing to rough it on the road, the camper van can be a more affordable option.

Then there are the more creative approaches to mobile living. People have converted school buses and vintage Airstreams into living quarters. Choosing the vessel for your life on wheels is an important decision, so weigh your options carefully.

How will you use it?

Previously, people bought mobile homes when they retired. These days, the options for remote work allow more people to embrace a mobile lifestyle, with many variations. Some people want to travel regularly, while others park their homes and only occasionally switch locations.

My motivation for buying a van was the freedom to spend month-long stints on the road and rent out my house whenever I left. As a freelance writer, I often travel in search of stories, and this seemed like a perfect way to do so. I could have the comforts of home and the freedom of wheels.

However, since dropping $5,500 on the initial purchase and about $1,000 in repairs, I've landed a full-time job. It's now more of a weekend camping vehicle than a home. The extra headspace that once seemed luxurious now feels cumbersome, especially when I'm driving over windy mountain passes and spending $60 to fill up my tank. Also, the $80-per-month insurance feels extra expensive, now that I'm paying for something I don't often use.

I'll travel regularly in my van someday, but my experience illustrates the importance of knowing how your van will facilitate the life you wish to lead. Where will you go, how often will you go and what will you do? Looking back, I would have gone for something a little smaller and lower maintenance.

Freedom can become debilitating if you don't know how you'll use it.

Where will you park?

Campgrounds, RV parks, Walmart parking lots and city streets have all become temporary homes for people who live on the road. But you must consider parking laws, safety and cost - every single night.

RV parks and many campgrounds offer hookups for electricity and water. If your home is designed to accommodate those amenities, they're nice to have. It helps to research campground details before you hit the road. 

If you're freeing yourself from rent or a mortgage, you might not want to dump that money back into parking each night. National forests offer free camping, as long as you're 100-200 feet away from any road, trail or water source. Ask local ranger stations about access to dispersed camping and local regulations. 

While mobile life is often celebrated with a backdrop of ocean beaches or beloved national parks, cities are something to consider too. They just require a little extra consideration.

Vans have a leg up on bigger, flashier RVs when it comes to cities, especially if your van doesn't look like someone lives in it. 

The most important piece of advice when considering where to park: Do your research. Reserve a spot when heading to popular parks, call ranger stations for information about parking in the area, join local forums, and always collect information ahead of time so you you're not searching for a place to sleep in the middle of the night with no service.

How much does it cost?

Paring down your belongings can be a great way to save money. But mobile living isn’t always cheap.

First, there's the cost of your vehicle, which can vary considerably. Conversions - van, Airstream, school bus, etc. - can be expensive, even if you’re doing the work yourself. For example, this stylish Sprinter van conversion cost $54,120You'll see a huge range on RV prices as well, from several thousand to millions of dollars.

Once you find a home that’s right for your budget, you'll need to consider living costs too.

Camping fees are about $20 per night, which can be alleviated by free parking. But you won't get water and electrical hookups unless you pay for them.

Vehicle insurance will add a few hundred to several thousand dollars in yearly costs. Comprehensive auto insurance, while more expensive than bare-boned liability plans, will protect your home and belongings from vandalism and theft.

I learned the hard way that an RV insurance plan is required of any vehicle that's been converted into a living space. Even though my van isn't technically an RV, AAA initially refused to tow me when I broke down in Seattle because I didn't have RV insurance. I've since upgraded, which has been worth it for the peace of mind. 

Depending on the age and condition of your vehicle, you'll also need to factor in regular repairs. And don't forget gas money! You'll spend a lot more on gas for your mobile home than you will on filling up your regular car. And the more toys you carry with your mobile home, the more your gas bills will climb.

Where will you go to the bathroom?

Unless you're able to find a mobile home with a built-in shower and toilet, personal hygiene can be a challenge on the road. But there are plenty of creative ways to make it work.

A membership to a gym chain with locations across the country, like Planet Fitness or L.A. Fitness, will allow you to access showers and bathrooms - not to mention a workout, which can be vital when your living space only allows you to walk a few feet in either direction.

Campgrounds and truck stops also provide facilities to the traveler looking to freshen up.

If you don't have a toilet, you'll likely find yourself using truck-stop and cafe bathrooms. But a late-night bathroom break could mean toilets aren't available, and you'll have to settle for whatever is around.

Can you work on the road?

Remote work opportunities have freed many people from the constraints of a typical office job. But working from a mobile home is much different than a home office.

First, consider how often you'll need to work and where you'll be able to do so. It might be helpful to stay close to developed areas where there are plenty of establishments offering free Wi-Fi.

If you can work comfortably inside of your mobile home, you can use your mobile device as a Wi-Fi hotspot or purchase a dedicated Wi-Fi hotspot for $100-150. Whichever option you go with, you’ll need to sign up for a service plan with data. Check on the coverage area of service providers before you pick one - they're no use when you're in a dead zone!

Working from the road also means you'll need electricity, which is nice to have for other uses, too, like charging your cell phone or running a fan to stay cool when your engine is off.

Solar panels are a convenient, rechargeable and environmentally friendly energy source. 

I can see my van parked on the street from the window of my house right now. I'm still not entirely sure what a mobile life will look like, but figuring it out is half the fun.

Related:

Originally published September 2017.


via Van? RV? School Bus? 6 Questions to Ask Before Choosing a Home on Wheels

6 Yurts That Will Have You Dreaming of Your Next Adventure

New Home Sales: All About the Revisions

Despite a positive headline figure, June’s new home sales are a wake-up call for a sector that enjoyed an otherwise solid start to 2019. Sale counts are still ahead of where they were last year, but each of the three previous month’s releases were revised down, inflating the appearance of June’s monthly gain. Prices have leveled off after steadily falling in recent months, a discouraging sign for buyers. The sector isn't out of the woods: Home construction rates have slowed recently and much of the continued growth of new home sales relies on builders putting up smaller, less expensive homes. New home sales have room to grow, but at a gradual pace. Clearly, it’s important not to glean too much from a single month’s report, given that this series often is subject to frequent revisions.

The post New Home Sales: All About the Revisions appeared first on Zillow Research.


via New Home Sales: All About the Revisions

Tuesday, July 23, 2019

Florida Boasts 9 of the 10 U.S. Cities With the Most Vacation Homes

If you’re looking for the U.S. city with the most vacation homes, by number, that’s New York City. It’s popular, for sure — and it also has the most homes, period.

However, if you’re looking for the city where you’re most likely to come across a vacation home — where the share of all homes that are vacation homes is largest — that’s a different glittery strip: Miami Beach, where a quarter of all homes are dedicated to the vacay.

By the latter measure, nine of the 10 cities with the most vacation homes are in Florida. If you took that same measure among a longer list of metro areas, you’d find greater geographic diversity, but among a shorter list of the 184 cities with the most homes, Florida is the clear winner.

In these spots, at least one in 10 homes is a vacation home:

Miami Beach, FL

Share of all homes that are vacation homes: 24.9%
Number of vacation homes: 17,509
Median home value: $366,800

Pompano Beach, FL

Share of all homes that are vacation homes: 18.7%
Number of vacation homes: 10,794
Median home value: $214,000

Fort Lauderdale, FL

Share of all homes that are vacation homes: 16.2%
Number of vacation homes: 15,170
Median home value: $312,900

Cape Coral, FL

Share of all homes that are vacation homes: 15.8%
Number of vacation homes: 13,627
Median home value: $227,800

Boca Raton, FL

Share of all homes that are vacation homes: 13.1%
Number of vacation homes: 7,122
Median home value: $339,100

Hollywood, FL

Share of all homes that are vacation homes: 12.3%
Number of vacation homes: 8,416
Median home value: $277,500

Largo, FL

Share of all homes that are vacation homes: 12.3%
Number of vacation homes: 5,640
Median home value: $195,800

Clearwater, FL

Share of all homes that are vacation homes: 12.2%
Number of vacation homes: 7,072
Median home value: $211,100

West Palm Beach, FL

Share of all homes that are vacation homes: 11.6%
Number of vacation homes: 6,020
Median home value: $238,600

Scottsdale, AZ

Share of all homes that are vacation homes: 10.5%
Number of vacation homes: 14,120
Median home value: $478,200

The post Florida Boasts 9 of the 10 U.S. Cities With the Most Vacation Homes appeared first on Zillow Research.


via Florida Boasts 9 of the 10 U.S. Cities With the Most Vacation Homes

What Are the Top Interior Design Styles in Every State in 2019?

Existing Home Sales: Disappointing, But Not Surprising

  • Existing home sales dropped 1.7% from May to a seasonally adjusted annual rate of 5.27 million in June. Sales were down 2.2% from a year ago, according to the National Association of Realtors.
  • Inventory at the end of June climbed 1.0% from May to 1.93 million, staying flat from a year earlier.
  • The median price for an existing home rose 4.3% from a year ago to $285,700, the 88th straight month of year-over-year gains.

After a good May and a recent rebound in pending sales, June's lackluster existing home sales data is certainly disappointing – but not entirely surprising. Sales have struggled to achieve meaningful, consistent growth this year, despite friendly market conditions thanks to still-low mortgage rates and a strong labor market. Meager inventory levels, especially in the entry-level segment, and still-rising prices continue to limit the selection of homes available to more budget-conscious buyers. It's not all bad news, however, and it's important not to overreact to one disappointing report. Despite a lack of noticeable growth, the level of home sales has remained fairly steady after a lousy end to 2018. Purchase mortgage applications have grown consistently over the past few months and inventory levels are up in a number of large markets, admittedly from very low levels to begin with. Buyers are out there, and demand should remain steady enough to support current sales levels. As the busy spring home shopping season winds down, a sharp rise in sales is probably not on the horizon.

The post Existing Home Sales: Disappointing, But Not Surprising appeared first on Zillow Research.


via Existing Home Sales: Disappointing, But Not Surprising

Fellow Earthlings, We’ve Detected 11 Homes on the Market Near Area 51

Monday, July 22, 2019

Frank Lloyd Wright Fixer-Upper Is for Sale, but the Repairs? Scary!

Home Remodeling Spending Expected to Slow Over the Next Year

If You Can Buy Here, You Can Buy Anywhere: Where in NYC Prices Are Rising and Falling Most

U.S. Rent Growth Accelerates as Home Values Stabilize (June 2019 Market Report)

  • Rents grew for the ninth straight month, and are now up 3% year-over-year. The median monthly rent in the U.S. is $1,483.
  • Home values grew 5.2% year-over-year, down from 7.6% annual growth at this time last year.
  • For-sale inventory in the U.S. fell 0.8% annually. There are 12,128 fewer homes for sale than in June 2018.

A surge in new apartment supply over the past few years that temporarily muted rent growth for much of 2018 has seemingly been fully digested by the market, with rent growth re-accelerating throughout the first half of 2019.

The median U.S. rent rose 3% in June from a year ago, to $1483/month, according to the June Zillow Real Estate Market Report. Rent was up year-over-year in 49 of the nation's top 50 markets (Milwaukee is the only exception) and is growing faster than a year ago in 43 of those 50 markets. Among those 50 large markets, annual rent growth was fastest in Las Vegas (up 10%), Phoenix (8.4%), Orlando (7.4%), Jacksonville (6.6%) and Riverside (6.3%).

Annual U.S. rent growth hasn't been at 3% since early 2016, when pent-up pressure in the rental market after a year of breakneck rental appreciation spurred record numbers of multi-family building permits. Much of that new rental supply tended to be concentrated in large apartment buildings in dense downtowns and was generally of similar (largely above-average) quality. Many of these newer properties competed with one another on price during their initial lease-up periods, muting rent growth throughout much of 2017 and 2018 as they began to open en masse.

The annual pace of rent growth turned negative (rents fell slightly year-over-year) for a brief two-month stretch in September and October 2018 as the market absorbed the new supply. But that absorption process seems to be ending, and demand from renters – both from existing tenants content to stay in their units and from younger, would-be tenants beginning to strike out on their own – remains strong. After that brief slowdown, annual rent growth has accelerated in each of the past nine months compared to the month prior.

Home Value Growth Cooling, Normalizing

But as rent growth has strengthened, home value growth has continued the gradual slowdown that has marked the for-sale market since the beginning of the year. The median U.S. home value grew 5.2% year-over-year in June, to $227,700 – down markedly from 8.1% annual growth in January, but still a healthy pace that is well-above historic averages. After a slight (-0.1%) monthly decline in April – the first monthly dip in more than seven years (February 2012) – monthly home value growth resumed in May and June, and home values have recovered all losses. The very brief monthly decline and small monthly gains that followed are less-indicative of a market about to enter a prolonged downturn, and more in line with a market that is slowly normalizing and slowing to a more sustainable pace of growth after several years of very rapid appreciation.

Annual home value growth slowed over the past year in 42 of the nation's 50 largest housing markets. The large markets in which home value growth slowed the most in June were San Jose, Seattle, San Francisco, Las Vegas and Dallas. All eight large markets in which home value growth accelerated over the past year – New Orleans, Birmingham, Oklahoma City, Raleigh, Cincinnati, Milwaukee, Indianapolis and Louisville – are notable for their relative affordability compared to their peer markets. In six of those eight accelerating markets, median home values are lower than the national median (Milwaukee and Raleigh are the exceptions).

Low Inventory Expected to Remain a Persistent Problem

The number of homes for sale nationwide fell 0.8% in June compared to a year ago, and was down 1.2% from May. After a six-month stretch of modest annual growth spanning the end of 2018/beginning of 2019 – a growth spurt that ended an uninterrupted, 56-month streak of annual inventory declines – the number of homes for sale nationwide has fallen year-over-year in each of the past four months. Inventory was up in a small majority (26/50) large markets, and grew the most in Las Vegas (up 54.3% year-over-year), San Jose (37.2%), Salt Lake City (21.3%), San Francisco (20.8%) and Denver (20.4%).

After years of declines, inventory appears to have largely hit bottom, but not yet begun to rebound in earnest. Instead of moving decisively in one direction or another, over the past 8-12 months inventory has been bouncing up and down by small amounts. We expect this to continue in the near term as the market grapples with a number of difficult-to-solve inventory challenges that are helping keep inventory low, including (but not limited to):

  • Lackluster new construction activity, as builders struggle with scarce land, expensive labor and volatile materials costs.
  • Little long-term movement in the number of fresh listings hitting the market each month.
  • A surge in the popularity of renting single-family homes, particularly among institutional investors that buy and keep these homes as rentals when they might otherwise enter the market as fresh for-sale inventory.

The post U.S. Rent Growth Accelerates as Home Values Stabilize (June 2019 Market Report) appeared first on Zillow Research.


via U.S. Rent Growth Accelerates as Home Values Stabilize (June 2019 Market Report)

Friday, July 19, 2019

Home Turf: Faux Grass Delivers the Green Without the Fuss

Discounted Duggar Mansion in Arkansas Is This Week’s Most Popular Home

Thursday, July 18, 2019

10 Most Affordable Markets for Renters

Affordability is a relative concept in housing. Markets that seem affordable because their median rent is on the low side may actually be unaffordable to people who make the typical wage there. So, we measure affordability by the share of median household income that residents pay for an area’s median rent.

In the United States, typical renters spend 27.8% of their incomes on rent. These markets are the most affordable among the largest 50 metro areas — updated with data from the first quarter 2019. (Median monthly rent data are from May 2019.)

1. Pittsburgh, PA

% of household income spent on rent: 21.4%
Average % spent on rent, 1985-1999: 28.4%
Median monthly rent: $1,105

2. St. Louis, MO

% of household income spent on rent: 21.5%
Average % spent on rent 1985-1999: 21.2%
Median monthly rent: $1,163

3. Oklahoma City, OK

% of household income spent on rent: 22.5%
Average % spent on rent 1985-1999: 20.6%
Median monthly rent: $1,119

4. Raleigh, NC

% of household income spent on rent: 23.2%
Average % spent on rent 1985-1999: 18.9%
Median monthly rent: $1,476


5. Kansas City, MO

% of household income spent on rent: 23.4%
Average % spent on rent 1985-1999: 17.5%
Median monthly rent: $1,303

6. Indianapolis, IN

% of household income spent on rent: 23.8%
Average % spent on rent 1985-1999: 21.8%
Median monthly rent: $1,239


7. (tie) Detroit, MI

% of household income spent on rent: 24%
Average % spent on rent 1985-1999: 20%
Median monthly rent: $1,229


7. (tie) Louisville, KY

% of household income spent on rent: 24%
Average % spent on rent 1985-1999: 19.9%
Median monthly rent: $1,198


9. Birmingham, AL

% of household income spent on rent: 24.1%
Average % spent on rent, 1985-1999: 19.2%
Median monthly rent: $1,111

10. Cincinnati

% of household income spent on rent: 24.2%
Average % spent on rent 1985-1999: 19.1%
Median monthly rent: $1,305

The post 10 Most Affordable Markets for Renters appeared first on Zillow Research.


via 10 Most Affordable Markets for Renters

Most Expensive Listing: $75M NYC Penthouse With Central Park Views

Yacht Owners Ditch Life on Land for the High Seas

Home Prices Have Shot Up Way More Than You Thought Since the Recession

Wednesday, July 17, 2019

8 Budget-Friendly Staycation Ideas for Families

Disneyland, the beach, camping … just a few of the many places your kids would nominate as a vacation destination this summer. But staying home?

B-O-R-I-N-G.

So how do you sell a staycation to your little ones? And not spend a ton of money? Fill it with fun and adventure.

Look for activities that are simple to pull together and entertaining for all ages - bonus points for those with educational benefits.

Check out these nine kid- and budget-friendly ideas - and a few tips from a frugal mom - that will make your summer staycation just as lively and memorable as any trip.

Camp out in your backyard

Pitch a tent, grab the camp chairs and roll out those sleeping bags. It’s time to go camping - in your backyard!

Study the local flora and fauna, practice wilderness skills, roast marshmallows over a fire pit, tell scary stories and spot constellations in the night sky.

Get your chef on

Let your little chefs put their skills to the test with a “Top Chef” competition. Introduce a mystery ingredient, work in teams and see what you can come up with.

If competition isn’t your style, simply head to the farmer’s market or grocery store and pick out a unique ingredient and see what your family can come up with to put in a dish.

Have a sweet tooth? Throw a bake-off and create your favorite cookies, cupcakes or cake. Share the snacks with friends and neighbors too.

Family carnival

Create your very own town fair, and bring your friends and family members in on the fun. Serve up classic carnival food like corn dogs, french fries, funnel cake and cotton candy.

Set up DIY games like ring toss, cake walk, corn hole, balloon darts, a fishing hole and more.

Finish off the night with an outdoor movie by stringing up a sheet and using a projector.

Learn something new

Take an online course to learn a new skill or craft, or figure out how to play an outdoor game like bocce ball or croquet. Practice a different language with books from the library, or hit the zoo to learn about a new animal.

Build a fort

Wrangle all the cardboard boxes, blankets, chairs and pillows you can find and build the ultimate playhouse or fort.

Construct tunnels with boxes (bonus if you can snag a large refrigerator box), create rooms with blankets and chairs, and arm your fortress by building a pillow moat. Play castle or just snuggle up in your cozy den and watch a movie - don’t forget the popcorn.

Keep the fun going into the night: Add twinkle lights and have a sleepover in your new castle.

Cool down with water play

Hot summer day? Cool down by making your own backyard into a mini water park.

Break out the sprinkler and burn off some energy by splashing around. Fill the kiddie pool and hop in with your little ones, or wage a water balloon or squirt gun fight for an afternoon that’s guaranteed to cool you off and make you feel like a kid again.

Live in an apartment or don’t have the water gear? Head to your local splash pad or community pool. To save money, look for free or discount promotions at the pool or water park.

Find your inner artist

Arts and crafts are a great way to get those creative juices flowing, make fun memories and create cool pieces to treasure for years to come.

Tie-dye some plain T-shirts, create your own modeling clay using flour and salt, make beaded bracelets, or try your hand at loom weaving.

Keep things even simpler by drawing with some sidewalk chalk, building a birdhouse out of Popsicle sticks, or simply getting messy with some finger paint.

Plan a treasure or scavenger hunt

Set up a string of clues for your kids to follow that lead them all around the house, yard and even the neighborhood. Make up your own clues or check online for clever rhymes or location ideas.

End the hunt with a fun prize, which can be anything from a chest full of faux gold coins, a long-desired toy or trinket, or a plate of fresh cookies or cupcakes. Add a dash of extra fun by dressing up as pirates or explorers.

Whether you have a lot of free time or a little, a chunk of change to spend or a limited budget, there are plenty of fun staycation ideas to make your summer special.

Related:


via 8 Budget-Friendly Staycation Ideas for Families

Foreigners Are Buying Less U.S. Real Estate—So What’s the Impact?

Prepare for the Ultimate Staycation

You don't need to stay in a hotel and play tourist to have a proper staycation. Look no further than your own home for a staycaytion dreams are made of.

Make no mistake, an at-home staycation doesn’t just mean a lazy weekend on the couch. Turn your humble abode into a resort made for relaxation with a few days of planning and prep work.

Here’s your guide to creating the ultimate staycation.

Tackle chores in advance

Make a list of chores you want to tackle a few days before your staycation begins. At the very least, cover the basics like washing linens, dusting and vacuuming.

For an added level of sparkle, schedule time to clean your windows. That way when you're staring out to your backyard garden or pool (aka your staycaytion resort spa), your windows will be as spick-and-span as those at a five-star bed and breakfast.

Better yet, for a totally chore-free staycaytion, consider setting aside extra cash for a housecleaning service to do the work for you beforehand.

Maximize your comfort

Maybe your home is already perfectly comfy and cozy. But for maximum staycation relaxation, why not add a few extra elements to make your home feel like a luxury resort?

  • Adjust your lighting. Look for soft ambient lighting options to create a calming environment. New lamps for bedroom and living areas and candles for the master bath can completely change the mood of a space.
  • Add new rugs. Soft, plush area rugs boost the comfort level of a room and make a cozy reading spot if you add a few floor pillows.
  • Buy new bedding. Not only will it feel like you're truly on a vacation somewhere else, but new sheets are an added perk after your leisure time comes to a close.

Create designated spaces

Think about what kind of environment will help you reach peak relaxation. You can do a quick makeover of your bathroom to create a calming home spa or carve out a quiet corner for a meditation or reading nook.

If a spa setting is more your style, look at bath pillows, aromatherapy candles and bath oils. Or if you simply crave a reading corner, pick up some new reads that have been sitting on your wish list for too long.

If you have kids, create a designated craft or board-game corner, or come up with a few activities they can enjoy while you relax.

Look outside for added comfort ideas too. Whether it’s a hammock, a porch swing or patio furniture, look for ways to blend your staycaytion lounging with the great outdoors.

On that note, consider setting up your camping gear in the backyard for part of your staycaytion, or try out a DIY fire pit for late-night chats and s’mores.

Manage meals ahead of time

Don't waste precious relaxation time planning menus. Pick your favorite family recipes, plan which meals you’ll have delivered and knock out grocery shopping before your staycaytion begins.

If you enjoy cooking, consider using some of your staycation time to make more intricate meals than you typically have time for - or bring in a local chef for a cooking lesson.

Plan ahead to make it count

With a few preparatory tasks on your to-do list, you can turn your house into a staycaytion sanctuary. Map out what you want your staycation to be like, and delegate tasks. Soon you'll be ready for a few days of ultimate relaxation - without ever leaving your home.

Related:

Originally published July 5, 2016.


via Prepare for the Ultimate Staycation

U.S. Housing Starts Declined 0.9% in June

June Housing Starts: Still Sluggish

  • June housing starts fell 0.9% from May to 1.25 million units (seasonally adjusted annual rate). They’re up 6.2% from a year ago, according to the U.S. Census Bureau and the U.S. Department of Housing and Urban Development. Single‐family housing starts in June rose 3.5% from May and fell 0.8% from a year ago.
  • June permits dropped 6.1% from May to 1.22 million and 6.6% from June 2018. Single‐family authorizations in June rose 0.4% from May and fell 4.7% from a year ago.
  • June housing completions fell 4.8% from May and 3.7% from June 2018. Single‐family completions were at a rate of 870,000, 1.8% below May and rose 1.6% from a year earlier.

June was the fifth consecutive month in which single-family starts fell from the prior year. A sluggish first half of 2019 indicates that builders have so far not been as willing or able to put up as many new homes as the strong economy and milder summer weather might otherwise suggest. A dearth of affordable land and labor continue to weigh heavily on housing starts, headwinds that sustained low mortgage interest rates and a strong job market haven't overcome. The housing market moves slowly, and as the direct challenges faced at the start of the year – including a prolonged government shutdown and a late-2018 spike in mortgage rates – fade more fully into the rearview mirror, the back half of 2019 will start to look better. Already in today’s figures, there’s a year-over-year increase in total housing starts, including multi-family — up from a fairly weak June 2018. Construction payrolls were up in June, and the jump in housing permits in May indicates more starts on the horizon — although permits fell again in June.

The post June Housing Starts: Still Sluggish appeared first on Zillow Research.


via June Housing Starts: Still Sluggish

Tuesday, July 16, 2019

Affordable beach communities you can commute from

They Are Out There! 10 Homes Under $100K for Bargain Hunters Everywhere

Monday, July 15, 2019

3 Simple DIY Driveway Ideas

A DIY driveway can be an easy want to add parking or improve the look of your home. Here are three relatively simple options.

1. Carve out a parking pad

The easiest, most affordable way to get an extra parking space is to clear out some grass and throw down mulch. It works fine, looks good and can be done in a day.

But beware: Mulch isn't a permanent solution. Mulch breaks down over time, floats away in a heavy rain and fades in the sun. Over time, you may end up spending more money sprucing up the mulch than you would have pouring concrete in the first place.

Be sure to use a store-bought landscape barrier, or even lay down newspaper to prevent weeds.

If mulch seems too temporary, consider other loose materials like gravel, stones or crushed oyster shells.

2. Build a DIY driveway with pavers

A more solid parking option is a concrete or brick paver driveway. It can be installed either professionally or DIY. Thousands of videos online show the steps and all the tricks of the trade. It's really quite simple:

  1. Excavate the area to be paved.
  2. Install a base material, such as crushed concrete, at a thickness of a few inches.
  3. Pack down the base material with a compactor, making sure to slope it as desired.
  4. Install a thin layer of sand on top of the base material.
  5. Install paver blocks on the sand layer, laying them in place in the pattern of your choice.
  6. Install a border row of bricks along the edges, and back that row with a poured concrete edge restraint, which will keep things from moving outward.
  7. Put another layer of sand on top of the finished surface and broom it into the joints between the bricks.

When installed properly, a paver driveway can last for decades.

3. Go with classic concrete

Finally, there is the tried-and-true concrete driveway. There's a reason concrete is still the most common driveway product in the world: It looks good, doesn't cost a fortune and lasts a very long time.

There are fewer steps to pouring a concrete parking area than there is to installing pavers, but it's not quite as beginner-friendly. If you've never poured concrete before, it's a good idea to start with a smaller area, such as a sidewalk, before tackling a large area.

Related:


via 3 Simple DIY Driveway Ideas