Pending home sales came roaring back in May. Consumers are saving at a historically high rate, potentially posing problems for the economic recovery. And wage cuts are more common in this recession than in recessions past.
A record increase in pending home sales
The NAR Pending Home Sales Index rose 44.3% in May from April, the largest one-month rise ever recorded.
The index is down just 5.1% from a year ago.
Consumers continue to save at a historic rate
The personal savings rate fell 9 percentage points in May from April, but remains at 23.2%.
Prior to the pandemic, the official rate was higher than 10% only once since 1995.
Wage cuts are far more common than a decade ago
11.4% of workers experienced a wage cut in March, April and May, according to the Brookings Institute.
During the Great Recession, just 6% of workers had their wages cut.
So what?
It was only a matter of time before home sales metrics started to improve. Higher-frequency reads of housing market activity and homebuyer demand show marked signs of progress over the last two months, but because of how it is measured the official reading on existing home sales had yet to catch up. That changed today with the release of May's pending sales index – a gauge of signed contracts on sales of existing homes, and usually a leading indicator of home sales in the next one to two months – and the news was even better than expected.The 44.3% monthly increase was easily the largest-ever one-month jump for the series. Pending sales in May were just 5.1% below last year's levels, meaning that despite a precipitous decline in the early Spring – in which the reading fell by more than 20% in successive months to as low as 34% below last year's levels – this forward-looking indicator on the housing market is within striking distance of where it was this time last year.Improvement in sales of existing homes in both June and July from earlier in the spring should be similarly stellar when they are released in coming weeks.
Friday's release of May consumer spending and income data was highlighted by the bounce back in spending and, more specifically, how much of it was thanks to government financial support. But another feature of the report requires attention – the savings rate among U.S. consumers remains historically high. The savings rate – defined as the share of disposable income that consumers do not spend – fell by 9 percentage points in May from April. But the rate remains historically high –prior to the pandemic, the national savings rate had never exceeded 17.3% and only once since 1995 has it even exceeded 10%. The increased rate of savings suggests that while tons of money is being pumped into the system, many people – particularly those with higher incomes and more stable job prospects – are holding off on spending, opting instead to sit on their cash. A failure to fully resume spending will likely impact those in lower-income occupations like leisure and hospitality and retail.If households decide that they would prefer to save their money for an even rainier day, due to the ongoing risks health and economic risks associated with the pandemic, revenue at retail stores, restaurants, theaters and other similar businesses of will continue to fall well short of pre-COVID levels, leaving those businesses unable or unwilling to hire back workers.
The losses in employment that the pandemic has caused have been well documented. But a related issue hasn't received as many headlines despite possibly having a similar impact on people's financial stability. According to a study from the Brookings Institute, cuts to base employee wages have been far more frequent during this recession thus far than they were previous recessions, including the Great Recession.The study shows that 11.4% of all workers received nominal wage cuts in March, April and May, nearly twice the share during the Great Recession (6%). Additionally, during the Great Recession, a small majority of all workers actually received wage increases, whereas so far during this recession, raises have been very rare.Of course, this current recession is only a few months old, so these trends might converge as this recession continues to evolve. But the report is yet another piece of evidence that the impacts to household balance sheets this time around have been very severe.
Click here to read past editions of Zillow’s Market Pulse updates.
The S&P CoreLogic Case-Shiller U.S. National Home Price Index® rose 4.7% year-over-year in April (non-seasonally adjusted), up from 4.6% in March.
Annual growth was also up from March in the smaller 20-city index (to 4%, from 3.9%) and was unchanged in the 10-city index (3.4%).
Phoenix (+8.8%), Seattle (+7.3%), and Minneapolis (+6.4%) reported the highest year-over-year gains among markets in the 19-city index (Detroit was excluded from the 20-city index this month).
Even as the nation shuttered its doors in April and large swaths of the economy came to a crashing halt, home prices continued to steadily increase.
The national Case-Shiller Home Price Index rose 4.7% year-over-year in April. The smaller 10- and 20-city composite indices grew more slowly, at 3.4% and 4% year-over-year, respectively. The annual rate of growth was higher in April than in March in the national and 20-city indices, and was unchanged in the 10-city index. On a monthly (seasonally adjusted) basis, the 10- and 20-city indices were up both up 0.3% from March; the national index was up 0.5% month-over-month.
Index
Zillow Forecast, Released 5/26/20
Actual Case-Shiller Indices,
Released 6/30/20
Historical Median Absolute Error*
10-City Composite,
Month-Over-Month (SA)
0.3%
0.3%
0.2%
10-City Composite,
Year-Over-Year (NSA)
3.7%
3.4%
0.2%
20-City Composite,
Month-Over-Month (SA)
0.3%
0.3%
0.2%
20-City Composite,
Year-Over-Year (NSA)
4.2%
4%
0.1%
U.S. National
Month-Over-Month (SA)
0.4%
0.5%
0.1%
U.S. National
Year-Over-Year (NSA)
4.4%
4.7%
0.1%
*Calculation of Median Absolute Errors are based on Zillow’s forecasts dating to 2011. The national Case-Shiller forecasts began in 2014.
Even amid millions of lost jobs, health-related fears and an incredibly uncertain economic outlook, historically low mortgage rates in April helped to buoy the strong buyer demand that had been building in the months preceding the pandemic, fueling competition for the relatively few for-sale homes on the market and driving up prices as a result. That heightened demand hasn't wavered in the months since, as inventory continues to fall, mortgage rates keep finding new lows and measures of buyer activity have picked up markedly. Substantial risks remain and the longer-term outlook for home prices is still very much unclear, but at least for now, the housing market continues to cruise through this historic downturn more or less unscathed and prices seem poised to continue their ascent for the coming months.
Annual growth in May as reported by Case-Shiller is expected to slow slightly in the 10- and 20-city indices, and accelerate somewhat in the national index. S&P Dow Jones Indices is expected to release data for the April S&P CoreLogic Case-Shiller Indices on Tuesday, July 28.
Index
Actual April
Case-Shiller Change
Zillow’s Forecast for the Case-Shiller May Indices
10-City Composite,
Month-Over-Month (SA)
0.3%
0.3%
10-City Composite,
Year-Over-Year (NSA)
3.4%
3.3%
20-City Composite,
Month-Over-Month (SA)
0.3%
0.3%
20-City Composite,
Year-Over-Year (NSA)
4%
3.9%
U.S. National
Month-Over-Month (SA)
0.5%
0.4%
U.S. National
Year-Over-Year (NSA)
4.7%
4.8%
Note: Case-Shiller and Case-Shiller Index are registered trademarks of CoreLogic Solutions, LLC. The statements herein are not endorsed by or provided in association or connection with CoreLogic, LLC.
After three centuries, these 10 homes aren’t simply still standing—they’re also ready for a fresh start with a new owner.
For lovers of old houses, we’ve rounded up the 10 oldest homes to land on the market this week. What we uncovered is a collection of Colonial charmers with exciting stories to tell.
If you’re the entrepreneurial type, there’s a renovated schoolhouse built in 1715 that comes with an option to open an antiques shop.
There’s also Lapham manor, which was built in 1710 for an aristocrat. In Massachusetts, there’s a home that is believed to have hosted one of the first Japanese people in North America.
These aren’t just homes—they’re pieces of American history you can own! We’d love to hear from you if you make an offer on any one of these 10 oldies but goodies.
Price: $769,990 Built in 1700: This 320-year-old home has a dollhouse exterior and sits on a half-acre in the heart of town. Impeccably maintained over the centuries, this five-bedroom, Federal-style Colonial features a mahogany staircase, large great room, wide-plank pine flooring, and a yard filled with secret gardens to complete the fairy-tale feel.
Price: $775,000 Built in 1710: The listing says this is the oldest “authentically restored” home in the area. Known as the Lapham manor, the property is said to have originally belonged to an aristocratic Pilgrim. Today, the 96-acre gentleman’s farm includes a three-bedroom Colonial farmhouse, organic gardens, vineyards, an events barn, antique field sheds, and a pond.
Price: $300,000 Built in 1710: Known as the Pringle-Wooster house, this three-bedroom Cape Codder has been carefully maintained by its current owner over the past 30 years. It features beamed ceilings, three fireplaces, and wide-board floors. The 1.5-acre property sits next to the Katharine Matthies Woodland Preserve with 45 acres of open spaces and hiking trails.
Price: $425,000 Built in 1713: Part of the Manjiro Walking Trail, this home was where Manjiro Nakahama was given English lessons in the 1840s, according to the listing. Nakahama, a teenager rescued from a shipwreck by an American whaler, is said to have been one of the first Japanese people to live in America. Today the charming three-bedroom home has three fireplaces, wide-plank floors, and lovely gardens tucked among the trees on its half-acre lot.
Price: $2,999,500 Built in 1713: Called the Welcome Here Farm, this 60-acre estate has walking trails, a duck pond, trout stream, and 10-stall horse barn. The main house is simply grand. At 9,000 square feet, this Colonial is designed for entertaining a crowd in high style and features a large dining room as well as a bar and patio overlooking the pool out back.
Price: $639,000 Built in 1715: A local landmark, this Colonial schoolhouse was recently renovated. The three-bedroom main house features a family room with its original hearth and woodwork. There’s also a large loft over the barn and a guest cottage on the 3.3 acre-property, which is zoned for an antiques shop.
Price: $239,000 Built in 1715: Stone walls and sugar maple trees border this pristine 6-acre property, which was once part of the 200-acre Bicknell Farm. The Cape Cod–style main house has three bedrooms and a screened porch overlooking the pasture. The property, which includes a barn built in 2004, sits adjacent to the 25-acre Bicknell-Harris Preserve.
Price: $719,900 Built in 1719: Located near downtown, this 3,000-square-foot Colonial features a four-season sunroom and patio. The 1.4-acre property provides plenty of room to stretch out in the yard. All city residents are eligible to purchase a $20 annual pass to nearby Crane Beach.
Price: $339,900 Built in 1728: According to the listing, this may be one of the oldest homes in town. The 2,250-square-foot charmer has three bedrooms, six fireplaces, and wide-plank floors. The 1.5-acre lot can also be subdivided to build additional homes.
Price: $369,900 Built in 1734: This center-chimney Cape Cod is known as the Nathaniel Phelps Jr. home. Careful updates to the three-bedroom dwelling have created a nice balance of historic charm and modern convenience. The 4-acre property is surrounded by rustic stone walls and includes pastures, several outbuildings, a kitchen garden, and a variety of fruit trees and bushes.
LGBTQ+ home buyers are more likely to face a mortgage denial before getting approved and make sacrifices on the home they buy.
LGBTQ+ renters are more likely to have at least part of their deposits withheld, pay application fees) and experience higher rent increases.
Many of the challenges faced by LGBTQ+ households in general are even more extreme for LGBTQ+ buyers and renters of color.
As LGBTQ+ people fight for equal footing in the housing market, many still face disproportionate challenges compared to their cisgender, heterosexual peers — especially LGBTQ+ people who are lower-income and/or people of color, according to an analysis of data from the 2020 and 2019 Zillow Group Consumer Housing Trends Reports. These higher hurdles include more difficulty getting a mortgage, finding an affordable home and a higher likelihood of paying extra rental costs.
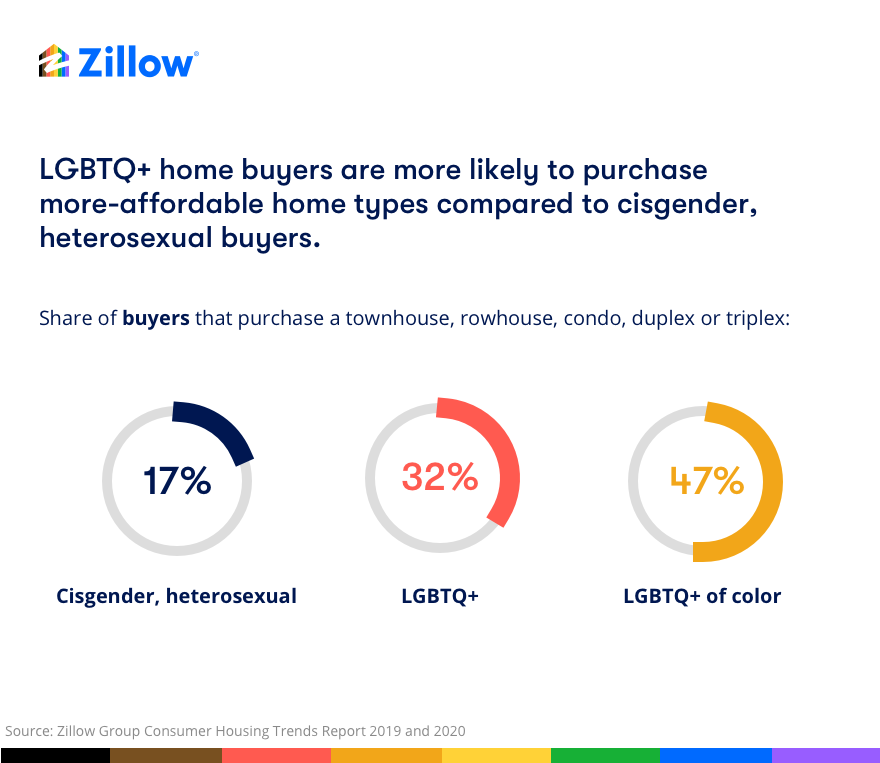
Previous Zillow research found that LGBT home buyers seeking a home in a state, county, or city that affords them legal protections from discrimination in housing and public accomodationcan expect to pay $127,000 morethan the typical home in a market with neither. This affordability challenge may in part explain why LGBTQ+ buyers gravitate towards more-affordable home types: Almost a third (32%) of LGBTQ+ buyers purchase a townhouse, rowhouse, condo, duplex or triplex, compared to less than 1 in 5 (17%) cisgender heterosexual buyers. Among LGBTQ+ home buyers of color, almost half (47%) end up purchasing these typically more-affordable home types.
But it can sometimes be difficult for buyers to find these types of homes, often because of restrictive zoning that prohibits their development and/or can make it very difficult for builders to construct this type of housing. Considering policies that can boost the availability and accessibility of these more-affordable home types could make homeownership more accessible to LGBTQ+ buyers and LGBTQ+ buyers of color.
Of course, finding a home they want to buy and can afford is only the first step — most LGBTQ+ buyers must then secure a mortgage, presenting another challenge. A third (33%) of LGBTQ+ buyers that take out a mortgage are denied at least once before ultimately getting approved, compared to 19% of cisgender heterosexual buyers with a mortgage. And again, for LGBTQ+ buyers of color the process can be even more challenging: (42%) of LGBTQ+ buyers of color are denied at least once before being approved for a mortgage.
Given these challenges, it is probably unsurprising that LGBTQ+ buyers make more sacrifices to make their deal work. More than two-thirds (70%) of LGBTQ+ buyers report making at least one sacrifice to stay at or below budget, compared to 57% of cisgender, heterosexual buyers, including buying a home that is in worse condition, lacks desired finishes and/or is smaller than initially planned. And more than three-in-four (78%) of LGBTQ+ buyers of color make at least one sacrifice, a far higher share than the 55% of white, cisgender, heterosexual buyers that report doing so.
A Similar Story for LGBTQ+ Renters
Much like their home buying peers, LGBTQ+ renters are also more likely to face higher hurdles when trying to find a home, including withheld deposits, higher application fees and/or bigger rent increases. LGBTQ+ renters that moved from a previous rental are less likely to get their full deposit back: Only 31% of LGBTQ+ renters get their deposit back in its entirety, compared to 40% of cisgender heterosexual renters. The gap widens among racial lines: Only a quarter (25%) of LGBTQ+ renters of color got their entire deposit back, compared to closer to half (44%) of white, cisgender, heterosexual renters.
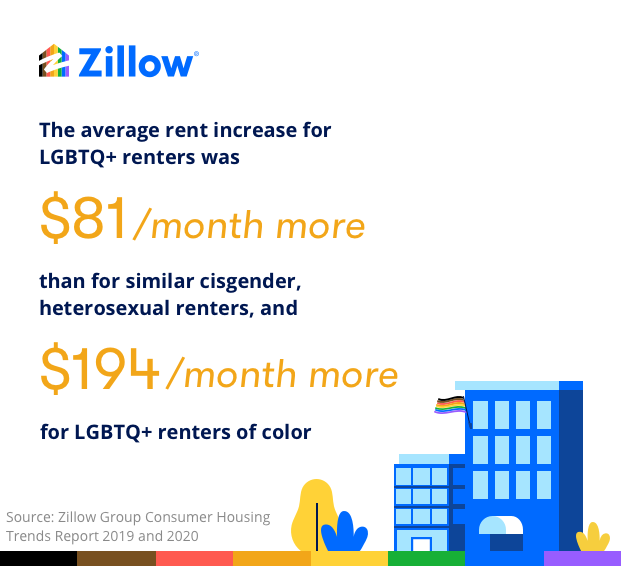
LGBTQ+ renters overall and cisgender, heterosexual renters are similarly likely to report experiencing a rent increase at their previous rental, but LGBTQ+ renters of color are significantly more likely to experience a rent hike than other groups. Almost all (90%) of LGBTQ+ renters of color who moved from a previous rental say they experienced a rent increase, compared to 76% of cisgender, heterosexual, white renters. And those rent increases are not only more frequent for LGBTQ+ renters of color, they are also more likely to be larger for the LGBTQ+ renter community overall.
Among renters who experienced a rent increase, 44% of LGBTQ+ renters overall and 46% of LGBTQ+ renters of color saw their rent go up by $200/month or more, compared to about a third (36%) of cisgender, heterosexual renters (36%). The average rent increase among all LGBTQ+ renters that experienced one was $81/month more than for cisgender, heterosexual renters. For LGBTQ+ renters of color, the average rent increase was $194/month higher than for white, cisgender, heterosexual renters whose rent went up.
And not only are monthly rent costs often higher for LGBTQ+ renters, upfront rental costs are also heftier. LGBTQ+ renters in general are more likely to pay an application fee (74% do), and LGBTQ+ renters of color even moreso (84% do), compared to 66% of cisgender, heterosexual renters. Total application fees paid by the average LGBTQ+ renter of color ($334) are more than double those paid by white, cisgender, heterosexual renters ($139).
And in the end, there is little payoff for LGBTQ+ renters to having overcome these hurdles and paid these extra costs:, LGBTQ+ renters are less likely to end up in the area in which they originally considered renting (53% vs. 59% of cisgender heterosexual renters). The divide is wider between LGBTQ+ renters of color (42%) and white, cisgender, heterosexual renters (63%). The most common reason that LGBTQ+ renters of color who didn’t end up renting in their initial area cite is that they couldn’t afford the homes for rent in that area (45%) — followed by 36% who said there weren’t many homes to rent in that area.
Looking Back, Looking Ahead
Despite these challenges, state and local governments can take actions to make finding home more equitable for LGBTQ+ households. Policies that legalize and/or pave the way for easier construction of lower-cost, often attached homes (many of which have been championed by LGBTQ+ lawmakers) can add more affordable inventory to markets attractive to LGBTQ+ buyers. Passage of the Equality Act would provide overt housing protections nationwide for LGBT populations; currently, 29 states and the country as a whole do not offer these kinds of legal protections for LGBT people. This Pride month, it's critical to celebrate how far the LGBTQ+ community has come — while also recognizing how much farther there still is to go to achieve true equality.
Consumers' outlooks are clouded by a renewed surge in coronavirus cases. Personal spending is up sharply, but there's not a lot to it. And after almost a month of slowdowns, participation in mortgage forbearance programs increased last week.
Consumers: The bottom is probably here, but what comes next is uncertain
The final June reading of the University of Michigan Index of Consumer Sentiment rose 5.8 points from May.
Sentiment in the Northeast improved the most on the month, and was largely flat in the South.
A record increase in consumer spending offers little substance
Personal consumption rose 8.2% in May from April, easily the highest one-month improvement ever recorded.
Incomes remain 3.8% above February's levels, thanks in large part to government support.
Participation in mortgage forbearance programs reaccelerates
After three straight weeks of decreases, the number of loans in forbearance rose last week.
8.8% of all loans are receiving assistance, according to Black Knight.
So what?
The final reading of the University of Michigan index of consumer sentiment slipped slightly from its initial read two weeks ago, but generally offered the same conclusion as before: Consumers' outlook has improved since bottoming out in April, and people are reasonably confident that economic conditions will at least not get worse. But expectations for the coming months remain subdued.And it's clear that recent surges in new coronavirus cases, and mitigation measures taken to stop them, aren't helping to clear up consumers' cloudy outlook. The headline index of consumer sentiment barely increased on the month in the South (up a scant 0.5 points), where case volumes have recently begun to take off. A slightly better, but still modest improvement took place in the West, which is also seeing a notable uptick in cases in many areas.But in the Northeast, where the spread of the virus has (at least for now) largely been subdued, the headline index rose by 19.9 points, an all-time record one-month increase. Nationwide, consumer confidence in federal economic policies has fallen to the lowest level since at least January 2017. So, nearly four months into this crisis, consumers’ outlook has stabilized, but the longer-term vision remains hazy and is tied closely to the coronavirus.
For some, it may be tempting to point to the record increase in consumer spending as evidence of an improved consumer outlook. The 8.2% monthly increase in personal consumption was driven in large part by purchases of more-durable goods including cars and furniture.But in reality, the headline data mostly offer false hope. Consumer spending levels remain almost 12% below pre-COVID levels. Annual growth in the core personal consumption expenditure (PCE) index – the inflation metric preferred by the Federal Reserve – was only just above 1%, well below the Fed's 2% target. More concerning, the monthly improvement was almost entirely due to an influx of cash made possible by federal stimulus checks and expanded unemployment benefits – policies that have either already expired or are set to expire in the coming month.Personal income in May was about $700 billion higher than it was in February, but employment compensation was about $1 trillion lower over that same span – a discrepancy that speaks to the enormous impact direct federal assistance has had on keeping the economy in decent shape amid this historic downturn. It also suggests that these increased spending rates will not last if these relief measures go away as planned.
After three weeks of decreasing participation, the number of loans entering into forbearance rose last week, according to Black Knight.The additional 79,000 loans in forbearance erases about half of the decreases accumulated over the last three weeks and is the latest sign that many households are continuing to experience significant financial stress and uncertainty. In all, 8.8% of mortgages are receiving some form of relief – about 4.7 million loans, with a combined outstanding balance of more than $1 trillion.FHA and VA loans – mortgages that have slightly more forgiving qualification standards – saw the largest weekly increase in number of loans receiving relief. Combined, 12.5% of these loans are in forbearance, the largest such group.
Click here to read past editions of Zillow’s Market Pulse updates.
Ah, Florida: warm weather, beaches, and no state income tax. No wonder it’s a favored destination for older Americans eyeing the golden expanse of work-free years ahead of them. And now that the coronavirus pandemic makes it unwise to socialize except at a distance, it’s more important than ever to be able to settle into a forever home where you’re free to enjoy the fresh air, long walks on the beach, and the soothing sound of crashing waves.
There are currently more than 74 million boomers—of which 10,000 per day are hitting age 65, according to the Pew Research Center. And as they shift into retirement mode, many are migrating toward the beach. According to United Van Lines National Movers Study, in 2018, 39% of the retirees they moved had their GPS systems locked on to Florida. Shocker, right?
In fact, the Sunshine State’s shorelines aren’t the only coastal ZIP codes attracting boomers—plenty of folks don’t want to live in what feels like a steam room six months out of the year, or they may want to be closer to friends and family elsewhere in the country. Instead, the 55-plus crowd has been seeking out budget-conscious, beach alternatives with plenty of outdoor activities and (often) a temperate climate in which to settle down for good.
“Retirees are undoubtedly drawn to these areas by the active, beach lifestyle,” says Danielle Hale, chief economist for realtor.com®. “And the relative affordability of homes in these towns means more of a fixed income is left over for fun, which probably makes the case for sticking around.”
From the peaceful dunes of Cape Cod and the warm waters of the Gulf of Mexico to the wild cliffs of the Pacific Northwest, these are the top 10 affordable beach towns and cities across the United States where retirees can kick back. And it turns out, they share some common features that are particularly attractive for folks who are no longer congregating by the water cooler.
“Retirees look for affordable communities where they can fill their time with purposeful activities and social connections, keys to a long, healthy life,” says Hale.
Infographic
Tony Frenzel / realtor.com
To come up with this list, our data experts looked at more than 1,300 towns on the water, pulled off the places that are located on lakes or rivers—this list is all about tasting the salt in the ocean breeze—and cut the selections to one place per state, for a wider variety of options. The ranking was based on the population of residents aged 55 and over per capita (the higher the better, we say), affordability based on median list price, access to hospitals and other health care facilities, the number of amenities like golf courses (for low-impact exercise) and country clubs (for the social scene), as well as marinas and water-recreation businesses like boating and fishing, for that all-around beach town experience.
Ready to take a long stroll down the list together? Let’s hit the beach.
Just 15 minutes south of the bustling tourist shops, boardwalks, and mini-golf courses of Myrtle Beach, Murrells Inlet offers retirees a quiet respite from that popular vacation town. The former fishing village is bordered by a beautiful marsh shoreline and dotted with wooded areas. It also boasts a strong health care system, numerous golf courses, and a stunning sculpture park and wildlife preserve, Brookgreen Gardens, hailed as one of the Top 10 Gardens in the United States by TripAdvisor.
The mild weather, coastal scenery, good airport, and myriad amenities have made Murrells Inlet a desirable retirement destination for Northeasterners seeking a break from high tax rates and harsh winters.
Retirees can get into affordable homes starting at just under $200,000, including this $196,919 two-bedroom in a 55-plus community or this three-bedroom with a whirlpool hot tub—and no age restrictions—for $249,900.
“You kind of have the best of both worlds [in Murrells Inlet] if you’re looking for a nice, affordable area to retire to,” says Jeremy Jenks, vice president of sales at Keller Williams The Trembley Group. “It takes 15 minutes to get to everything Myrtle Beach has to offer without having to worry about traffic and stuff.”
Venice’s shoreline is located halfway between Sarasota and Port Charlotte, on the eastern edge of the Gulf of Mexico. The powdery white-sand beaches are a paradise for sunbathers—or those who seek shade under an umbrella—and shell seekers. The city hails itself as “The Shark Tooth Capital of the World” due to the thick fossil beds that lie right under its gently lapping shores. The shallow and sedimentary conditions of the beach expose thousands of ancient shark teeth every day.
If hunting for shark teeth won’t keep the grandkids occupied, chances are nothing will—but you could always try taking them to the arboretum or Historic Venice Train Depot, or take them for a boat ride. Buyers can get into the market at a wide price range, from a three-bedroom manufactured home for $159,900 to this three-bedroom with water views and a private pool for $350,000.
Morehead City and the Atlantic Beach Bridge in North Carolina
Raynor Garey / iStock
Morehead City has enough nautical attractions to make die-hard boaters keel over. The port town offers great boating, fishing, and nearly every type of water sport imaginable in both the sound and the Atlantic. Homes start in the $200,000 range, and it’s possible to snap up a townhome with an onsite dock such as this sprawling three-bedroom for $274,000 or this $350,000 three-bedroom with water views.
Though Morehead City is on the mainland, protected from storms by a barrier island, the city proper isn’t known for its beaches. To hit the soft sand of beautiful Atlantic Beach, locals have to drive about seven minutes across the bridge.
Lewes and nearby Rehoboth Beach have become one of the hottest LGBTQ retirement destinations on the East Coast. The welcoming area boasts many gay bars and restaurants, a thriving Pride parade (in years past), and an LGBTQ center—all on the shores of tax-friendly Delaware.
Historic Lewes has a more natural, small-town feel and (slightly) lower home prices. Retirees can get into active adult communities like Bay Crossing in a $239,000 two-bedroom condo all the way up to a fully kitted-out four-bedroom for $620,000.
“It’s a popular gay retirement community,” says Russell Stucki, real estate associate at Re/Max Realty Group. “People enjoy it.”
New Jersey—and its infamous shore—gets a lot of flak, but it’s called the Garden State for good reason: It’s friggin’ beautiful when you exit the turnpike. That includes Toms River, a seaside town that’s nestled along the Atlantic Ocean and Barnegat Bay, a rich estuary that’s long been a destination for fishing, crabbing, and boating. The historic city boasts a vibrant downtown with shops and restaurants, 15 recreational parks (including a golf course), and waterfront views from both the mainland and the peninsula across the water.
Buyers looking for a deal can get into a one-bedroom home starting around $125,000 or even a four-bedroom right next to the water for $349,000.
Most folks probably don’t imagine spending their beachy retirement huddled up under layers of sweaters and blankets, but they’re missing out. The cliff-edged and chilly shoreline of Bastendorff Beach, just a short trip over the bridge from Coos Bay, is gorgeous, a wholly relaxing place to collect shells, pitch a tent, or ride a horse.
Many locals also take whale watching tours by boat, view masterpieces at Coos Art Museum, swing a 9-iron, or watch the pros play golf at the Bandon Dunes Resort, home to the Curtis Cup. Homeowners can look at the bay from their two-bedroom bungalow for just $169,000 or smell the salt air in a grand four-bedroom Dutch Colonial in the heart of town for a cool $649,000.
This is not a typo: Southern California does, in fact, boast affordable retirement homes right near the coast. Leisure World, a gated retirement community located just 12 minutes from the sands of Seal Beach, offers some serious deals. This renovated one-bedroom cottage is listed for just $199,999 and this two-bedroom at $225,000.
The large community has various purchase restrictions, including a minimum age, and in some cases requires all-cash transactions; but to buy in another part of the desirable beach town would cost at least $700,000. And locals are willing to fork over that kind of money for a reason. Seals actually do galumph around on the shore. The laid-back city boasts a restaurant- and shop-lined Main Street, which spills out to a nice pier and beach.
“Seal Beach is quaint and cute to walk around,” says Melinda Elmer, a Realtor® with Century 21 Masters. “It has a little bit of everything.”
Located at the mouth of the Thames River, this seaport city—the second-largest whaling port in the world back in the “Moby Dick” days—boasts a historic waterfront district that has become the creative hub of the city with art, music, and design venues, unique boutiques, and more than 30 restaurants. Retirees can take the grandkids on whale watching tours or picnic at one of the many parks or the beach.
However, what really makes this port town ideal for the 55-plus crowd is the easy access to quality health care. Part of Yale–New Haven Health, Lawrence + Memorial Hospital is home to the region’s only inpatient rehab unit and a nationally recognized cardiac rehabilitation program.
A two-bedroom condo right near the hospital and within walking distance to Ocean Beach can be had for just $99,000 and $209,900 can fetch a three-bedroom Cape Codder with a master bed and bath on the first floor, blocks from the water.
This Gulf Coast tourist haven has clean beaches, great fishing, and fantastic fowl. It has 10 birding sites on the Great Texas Birding Trail and the planet’s sole migrating flock of over 265 whooping cranes, which passes through the Aransas Wildlife Refuge every winter.
About 27% of the city’s 10,000 residents are aged 65 and up. Many of them seek out single-story homes with attached garages right around the golf course, marina, and beaches. They include this three-bedroom on the water for $275,000 and this two-bedroom cottage for $219,000.
With its bustling main street, John F. Kennedy Hyannis Museum, and world-renowned Cape Cod Hospital, Hyannis is basically the hub of the Cape. It’s home to lots of shopping, plenty of restaurants, nice golf courses, a great sailing scene, and beautiful beaches. It even has an airport and ferry terminal that connects the mainland to Martha’s Vineyard and Nantucket.
Many of the retired residents of Hyannis move into their former summer homes, but there are still plenty of boomers relocating to the area. Year-round homes start around $350,000 and reach nearly $4 million. Though a four-bedroom on the beach will set you back $1,650,000, a two-bedroom right next to downtown can be purchased for just $249,900.
“There’s still a lot of areas in Hyannis that are very affordable,” says Jeanette Neeven, a Realtor with Century 21 Cobb Real Estate. “Obviously, just like anywhere, the closer to the water you are, the more expensive the property.”
Unemployment insurance claims have seemingly stabilized at historic highs. Jobless claims are rising in emerging coronavirus hotspots. And more evidence is appearing that lower-income households are bearing the brunt of job losses.
Jobless claims show no signs of stopping
2.2 million claims for unemployment benefits were filed last week.
More than 33 million people are either receiving unemployment assistance or have recently applied.
14 weeks into the pandemic, the labor market situation is stabilizing but not improving
While overall employment increased in May, 9.3 million people still lost their job last month.
Sharp increases in jobless claims are popping up in some states with recent surges in new coronavirus cases.
Lower-income households more severely impacted by the weak labor market
Through mid-April, more than a third of workers in the bottom income quintile lost their job, compared to less than 10% of higher-income workers.
Government assistance has helped low-income families continue to spend.
So what?
Another 2.2 million people applied for unemployment aid last week, and while jobless claims have seemingly leveled off, they've done so at a historically high point roughly ten times more than the typical number of claims filed in a week before the pandemic.This far into the crisis it's easy to get lost in some of the historically grim numbers, but it's important not to get fatigued: Despite levels stabilizing, things remain extremely challenging — and true improvement is a ways off. About 33 million people are either receiving benefits or have recently applied and are awaiting receipt.Of those, about a third are receiving aid through the Pandemic Unemployment Assistance (PUA) program – reinforcing just how crucial it was that the federal government enacted that program in the early stages of the U.S. coronavirus outbreak.
Where we go from here in the labor market remains uncertain. Those who are optimistic about the outlook for the labor market will likely point to the fact that the economy added 2.5 million jobs in May and that the national unemployment rate fell on the month (despite remaining historically high). But a net increase to employment doesn't necessarily mean all is well in the job market, and glosses over the fact that millions of people remain out of work and are continuing to lose their jobs.While overall employment increased in May, 9.3 million people lost their job that month. As states and businesses continue to reopen, it's possible that we will see a similar statistic in next Friday's June employment report. But the recent surge in coronavirus cases in some states has begun to have a negative impact on local labor markets: Florida, Arizona and California all saw notable increases in jobless claims this week, a trend that will certainly accelerate should these states be forced to slow their reopening plans, or even shut back down.So while the broader picture of the labor market – and the economy – is showing that the recovery is underway, significant economic strife remains and continues to build.
And evidence that this lingering/mounting labor market strife is impacting broader economic factors is starting to emerge. A report from the Brookings Institution found that the hardship imposed on many U.S. households is particularly acute for those at the lower end of the economic spectrum. Through mid-April, more than 35% of workers in the bottom quintile of the wage distribution lost their employment at least temporarily as a result of the pandemic. The share of higher-income workers who lost their jobs was still high, but far lower — just 9%. What's more, a large share of workers who remained employed took a pay cut – something that not only introduces more hardship due to lost income, but also makes applying for full unemployment benefits more challenging. Currently, government support is helping to soften the blow and ensure that lower-income households have the means to stay afloat. A separate report from Brookings shows that spending among low-income households actually rose in the 6-week period ending May 30 compared to the same period in 2019, almost entirely because of government support. Absent this support, income for this group would have fallen more than 20% year-over-year, far greater than for those in higher income buckets. With the employment situation failing to show marked improvements, it seems likely that fiscal stimulus will need to continue in order to keep these households afloat.
Click here to read past editions of Zillow’s Market Pulse updates.
At one time, this was a lovely home. Today, not so much. The decrepit residence with shocking listing photos is this week’s most popular home on realtor.com®.
This week, many of you took a moment to click on what might be the saddest house in the country: an abandoned home in Flushing, NY, with uninhabitable interiors, punctuated by a rotting hot tub out back.
What caused folks to click like crazy was the property’s price tag—$828,888. The house isn’t salvageable, but it is sitting on a 4,912-square-foot lot in Queens.
The viral listing was first shared by a Twitter account affiliated with New York City’s EMT workers. It reads like a not-so-subtle dig at NYC’s affordability for its first responders.
Only one of this week’s most popular homes isn’t fit for human habitation. The rest of these clickworthy properties are sparkling and ready for you to move on in. Scroll on down for a closer look…
Why it’s here: Stylish digs just outside Milwaukee! Effortlessly cool and impeccably maintained, this midcentury modern from 1950 sits on 2 lush acres.
There are water features in the front and back, as well as an in-ground pool. Inside, the over 4,000-square-foot floor plan is open and features walls of windows.
Why it’s here: Built in 1900, this classic three-bedroom farmhouse is absolutely adorable.
The home has fresh paint and newly refinished wood floors, a rocking porch, and a mudroom. The over 2-acre property also includes an insulated studio, as well as a detached two-car garage.
Why it’s here: Dreamy from the curb, this pastel green cottage was built in 1998.
The four-bedroom home has been recently updated and is move-in ready, complete with a brand-new deck out back for observing the local wildlife. It sits on a half-acre and is just a quick bike ride to downtown.
Why it’s here: Built in 2013, this traditional three-bedroom brick house on a full acre of land is made for family living.
A wide front porch welcomes guests to the home and is a perfect spot to kick back and soak it all in. The house boasts hardwood floors, a security system, and a roomy rear patio.
Why it’s here: This circular midcentury modern house on the Hudson River would be a showstopper all on its own.
However, it’s received an extra boost thanks to the seller, “Real Housewives of New York” star Luann de Lesseps.
De Lesseps told the New York Post that she was rarely able to visit this gorgeous retreat from hectic city life. The property is on nearly a full acre, is ringed with decks for entertaining, and includes a full 200 feet of waterfront.
Inside, the three-bedroom home is stylish and designed for entertaining a crowd—or bickering with castmates. You decide!
Why it’s here: This once nondescript, two-bedroom condo was transformed into a blush pink, jewel-encrusted, Chanel-themed fantasia.
The current tenant—the woman who performed the awe-inspiring makeover—is moving out and is also willing to negotiate some of the furnishings along with the purchase.
Deep-pocketed buyers with a fascination with neo-Hollywood Regency should head for Beverly Hills!
Why it’s here: Listed on the National Register of Historic Places, this midcentury modern home is known as the Dr. Jean Chapman House. It was designed and built by local architect John Boardman in 1963.
Today, the four-bedroom marvel remains in impeccable condition. Original touches, like the solid walnut accent walls, rosewood cabinetry, and walls of windows, all remain intact.
Why it’s here: A social media superstar? Twitter sent folks scurrying to check out the unbelievable listing photos accompanying this uninhabitable mess.
And just when you thought your gross-out meter was in the red, a new horrific photo appeared. For us, the topper was the kitchen—which looks as if it’s been reclaimed by nature, with vines creeping up the walls.
It’s another case of an odd disconnect between premium price and horrific home. We’ve previously seenthisphenomenon in the San Francisco Bay Area, but it can crop up in any hot market where land is scarce and developers are plentiful.
The real question: Does the location of the lot justify this particular property’s hefty price tag? Social media opinion remains divided on the issue.
Despite a small step backward, for-purchase mortgage applications are firmly up from a year ago. In new virus hot spots, consumers' outlooks seem to be declining. And many small businesses remain on high alert, despite improving economic conditions.
For-purchase mortgages step back a bit, but remain above last year's levels
The Mortgage Bankers Association index of for-purchase mortgage applications fell 3% from the week prior, but remains 18% above last year's levels.
Seasonal factors and low inventory likely contributed to the decline.
Concern among households in new virus hotspots appears to be on the rise
Nationwide expectations for lost income and housing scarcity have fallen, according to the U.S. Census Bureau's Weekly Household Pulse Survey.
But Arizona, Texas and Florida have seen increases in some of these metrics, likely due in part to rising coronavirus cases.
Consumers' uncertainty is clouding the outlook for small businesses
A recent survey by the National Federation of Independent Business shows 14% of small businesses expect to layoff employees after exhausting loans received through the Paycheck Protection Program.
About 12% of these plan to reduce their staff by 10 or more people.
So what?
The news won't do much to dampen an otherwise strong overall resurgence in the mortgage market, but for the first time in a month and a half, purchase mortgage applications fell from the week prior, likely due to two factors. First is the persistent, historic shortage of for-sale inventory.Despite improvements in newly-listed homes entering the market, the level of for-sale inventory remains more than 17% below last year's levels. The lack of available homes on the market will help keep home prices from falling precipitously, but will also constrain the recovery of home sales in the coming months. Same goes for housing demand, as people will be less likely to enter the market if they don't see enough homes that fit their criteria. Seasonality is the other key factor likely contributing to the slight retreat in home purchase loan applications: In normal years, mortgage applications tend to top out in May before slowing through the late spring and early summer.The closure of large portions of the market earlier in the year very likely forced some buyers planning on purchasing in the spring to wait until the summer, contributing to the remarkable performance of the mortgage market in recent weeks.
In general, recent signals of consumer behavior have been fairly steady. Consumer sentiment and retail sales – to name a few – remain well below their pre-pandemic levels, but recent data show that some of these indicators have stabilized and, in some cases, are showing signs of improvement. Retail sales rose 17.7% in May from April, the largest one-month increase on record.But in many parts of the country – including some of those that have seen a recent surge in coronavirus cases – some of these promising trends have begun to reverse. According to the U.S. Census Bureau'sHousehold Pulse Survey, as of June 13, 35% of Arizona households said they expect their employment income to drop in the next four weeks — up from 27% in the week prior, and above the national average of 31%. In Florida, 34.3% of households said they either missed last month's housing payment or expect to miss their next one – far more than the national rate of 23.3%, and up from 27.9% a week ago. Similar trends are forming around food scarcity in Texas.The official release of consumer sentiment and spending comes on Friday, but for now it appears that concerns among households are beginning to heighten, particularly in parts of the country where the virus is running rampant.
Aside from the actual containment of the virus, uncertainty around consumer psychology is arguably the most important factor in the next phase of the economic recovery. News reports of renewed shutdowns have started to pop up in recent days, but a large-scale shutdown like we saw at the onset of the crisis appears unlikely at this point.So, the recovery will depend in large part on how confident consumers are in leaving their homes and spending at a relatively normal rate — especially at small businesses. At this point, measures of how/whether consumer patterns are changing in areas with renewed coronavirus outbreak are only anecdotal, but a recent report suggests that most small businesses remain on high alert.Arecent study by the National Federation of Independent Business (NFIB)shows that while economic conditions for small businesses have improved of late, many are still planning on an additional round of layoffs and are pessimistic about their ability to survive without additional government support.
Click here to read past editions of Zillow’s Market Pulse updates.
A waterfront estate on over 7 acres in North Palm Beach, FL, has landed on the market for $79.5 million. It’s the third-largest oceanfront parcel in Palm Beach County, and it’s also this week’s most expensive new listing on realtor.com®.
Only two other properties in the exclusive location are larger than this one: The Palm Beach empire of the billionaire investor Ken Griffin measures in as the largest, and the 15-acre Gemini Estate in Manalapan as the runner-up.
This mega-offering is described as an “unmatched oceanfront compound” in the listing and is marketed as a “once in a generation opportunity.”
As far as pricing goes, this property makes last week’s most expensive new listing—also in Palm Beach—look almost like an affordable option, with its $49.5 million price tag.
The nearly $80 million offering has the additional benefit of being located ina gated community, a perk for affluent buyers in search of added security and privacy.
A trust linked to the financier Gabriel Hoffman, who heads the hedge fund Accipiter Capital Management, is said to be the current owner, according to the Real Deal.
Oceanfront estate
Douglas Elliman
Entryway
Douglas Elliman
Dining room
Douglas Elliman
Outdoor dining
Douglas Elliman
Pool
Douglas Elliman
Set on the multiple-acre oceanfront parcel in this much-coveted neighborhood, the gated property features seven bedrooms, 11 bathrooms, and three half-baths on 15,514 square feet. Built in 1998, the Tuscan-style estate features panoramic ocean views.
Guests enter into a foyer with a curved staircase. The formal living room includes a stone fireplace and beamed ceilings. An ornate formal dining room features an intricate ceiling pattern and French doors. A huge chef’s kitchen features dual islands and looks out to the Atlantic Ocean.
Other highlights include a dedicated theater, wine room, tennis court, large private pool, and a guest suite.
Outside, a covered terrace features outdoor dining beside a fireplace. Steps lead down to the pool, which has a water feature. The grounds also include mature trees, a verdant lawn, and patios for entertaining, only steps from the sandy beach.
This is also “one of only a handful of properties in Florida where someone could land and take off in a helicopter from the estate,” the listing description notes. For wealthy buyers in love with the links, the home is just a short golf cart ride away from the tony Seminole Golf Club.
HGTV’s “Home Town” is a runaway hit. Show stars Ben and Erin Napier aren’t just restoring historic homes in Laurel, MS—they’ve also become major players in the town’s comeback tale.
The popular renovation program has inspired a few viewers to research home-flipping opportunities in Central Mississippi—while other viewers have tried to get cast on “Home Town.”
But what is it really like to be featured on the show?
Rhonda Phillips scored an appearance on Season 4, which recently ended. A dean of the Honors College at Indiana’s Purdue University and professor of agricultural economics, Phillips grew up in Bassfield—not far from Laurel—which initially sparked her interest in “Home Town.”
She appreciated the Napiers’ efforts not only in renovating old homes but also in sprucing up the faded Southern town. Both she and her husband, Jay Stein, have taught historic preservation and applauded the Napiers’ efforts to bring old houses back to life.
Phillips, whose episode aired in March, filled us in on her experiences on the hit show. (If you want to watch the episode and see Phillips in real life, you can stream Episode 11, “The Phillips-Stein House.”)
The journey to ‘Home Town’
“When I first saw the show, I absolutely loved it,” Phillips says. She felt it wasn’t a typical home improvement show. “This is about trying to make the town a better place, but to also recapture the beauty of some of the older homes that had been laid to waste.”
It took a severe winter storm in Indiana in February 2019 to point her mind southward.
“I lived away fora long time,” Phillips says of her rural hometown, about an hour from Laurel, where her mother still lives.She set her mind on buying a home in Laurel and having it renovated by the Napiers.
“I talked to my spouse. We decided to go for it. … We wanted to be part of the renovations and revitalization,” says Phillips. “This is home, this is connection, this is where I’m from. I just felt like it was a good time.”
The process to get on the show took months and involved phone interviews as well as a written essay. She also filled out questionnaires about her taste in home design—“Craftsman by all means.”
“Our family needs the connection to these roots while at the same time, we desire to be in an environment that is special,” she wrote. “We have lived in a variety of towns and cities throughout the years and are seeking what Laurel offers—a unique and special place to finally call home.”
Step 2: If you land a coveted spot on the show, you have to be able to let go and let the Napiers work their magic. No second-guessing.
Participants must agree to not see the house until the end of the process, says Phillips. “After you have all the contracts signed, and they know what your preferences are, they do the design. You take a leap of faith.”
Jay Stein and Rhonda Phillips
Rhonda Phillips
Once they signed the contract, the renovation went full speed ahead. For those who’ve ever tackled a renovation on their own, speed is usually not associated with the process.
The rapid nature of the renovations is one big benefit of appearing on TV.
“It was fast. They bring the whole team to a project. That itself is exciting,” says Phillips. Filming took place from the fall through December of last year.
“I knew it would be a magical transformation,” says Phillips.
First day of filming
Prior to Day 1, Phillips had been staying with her mother. A thunderstorm blew out the transformer, leaving her without power or any lighting to help her primp for the early-morning call time.
“I was sitting in my car putting my makeup on,” she recalls.
Prior to the cameras rolling, Phillips wasn’t aware of how much work goes into every scene. Even though it’s a reality show, a scene may have to be reshot because of background noise or bad lighting.
“There would be multiple retakes,” she says.“One scene could take hours to make. I never really realized that before. It is long days of filming.”
During the walk-through of the creaky Conner house—the home Phillips didn’t pick—she admits the retakes got to her.
The Conner house
HGTV
“I just remember there was one scene in the spooky house [where] we had to climb up the stairs. It was so hot up there, and I thought, ‘I am really ready for that scene to be over.’”
Spending a ton of time filming in the home from 1880s didn’t endear the place to Phillips.
“They couldn’t drag me into the attic again,” she says.
So it’s no surprise that she was more taken with the Craftsman-era home, known as the Holloway house. The four-bedroom, two-bathroom home from 1920 was on the market for $65,000. With renovations, the all-in cost was an estimated $165,000, well within the couple’s budget of $185,000.
“The homeowner pays for the house and the renovations,” says Phillips, noting that the Napiers make the renovation affordable by performing a lot of the work themselves.
However, there were plenty of challenges with the cute cottage she picked.
“It was just a sad remnant of its former self,” she says.
While many original details remained in the run-down interiors, one kitchen feature stood out, and not in a good way.
“The green stove hood was so atrocious, you can’t imagine what a monstrosity that this thing was,” she says.
The decision
Fans of the show know the next step is for the couple to announce their pick. While these meetings are usually held in a coffee shop, for Phillips there was a fun (and personal) surprise: a rendezvous with the Napiers at a historic train depot.
“They know my husband and I are into historic preservation,” she says. “They really do take into consideration what you do and what you like.”
In the episode, Phillips tells the Napiers they’ve decided on the Craftsman cottage. At that point, they had to bid farewell to the old home and wait until the “Home Town” team completed the renovation.
The cottage before the renovation
HGTV
“I had a high level of trust,” she says. “The house that we picked was in such bad shape, if anybody could fix it, it would be them and their team. And they did.”
Exit stage left
With the couple out of the picture, the overhaul begins and we see the work on the show itself.
The awful green vent above the stove is removed. The vintage kitchen sink is moved to the future laundry room. In a horrific twist not visible upon initial inspection, the Napiers discover Styrofoam was used to patch some of the walls.
Ben and Erin reuse a few of the home’s original doors they had found in a shed on the property. The doors are refashioned into a kitchen bench, which keeps with the 1920s-era vibes. Using reclaimed timber from trees that fell during Hurricane Katrina, Ben builds a storage bench for the entry.
Rather than create new trim, the team repurposed wood from the house, knowing the couple wanted to preserve as much of the original wood as possible.
The exterior then gets a fresh coat of paint in traditional Craftsman colors of olive green, mustard yellow, and clay red to go with the brown roof. For finishing touches, Erin selects period floral curtains by 1920s-era designer William Morris.
The cottage after the renovation
HGTV
Ready for a reveal
The big reveal is the one moment with no retakes allowed. The idea is to fully capture the emotions as people see their newly redone home for the first time.
“The element of surprise was real,” Phillips says. “I was a nervous wreck. You look up and see it for the first time. It was better than I thought [it would be] in some ways. For me and my husband, we were over the top about it. It was transformed.”
Kitchen renovation
HGTV
Focusing on preservation, the design is taken from the 1920s. The final product is a painstakingly restored timepiece, full of vintage details. While the home is staged with furniture from local sellers, some items are specially made for the home, including the bench Ben crafted.
“You go through, you have a master list to see if there are pieces you want to keep,” Phillips says. The master bedroom and dining room furniture stayed.
“My goal is to keep it to look almost exactly like it was staged,” she says. Except for swapping out some of the artwork seen in the episode, she’s managed to keep the home as it was on the day of the reveal.
The ‘Home Town’ aftermath
After the season wraps, the show traditionally holds a party for all the participants from that season—a fete “with a lot of food,” she says. Because of the coronavirus pandemic, there was no party for Season 4 participants—yet. Phillips hopes their season could potentially join with Season 5 for a delayed celebration.
The couple have five grown children who live all over the world, and only two of them have seen their “Home Town” retreat in person.
“We’ll have a family reunion there at some point,” Phillips says. The couple don’t live in Laurel full time quite yet, but do visit the area every few weeks.
Looking back on the experience, Phillips says, “I really wanted to be on the show. Because I felt it would be special and a lot of fun, and I was right about both of those.”