Tuesday, April 30, 2019

February Case-Shiller Results and March Forecast: Home Price Growth Slowest Since 2012

Home prices continued to tap on the brakes in February, moderating their earlier breakneck speeds, particularly in pricey West Coast markets. The S&P CoreLogic Case-Shiller National Home Price Index, which tracks home prices nationally and in major metro areas, rose 4% in February from the previous year, a slowdown from 4.2% in January.

Less expensive metros are zooming past their pricey coastal counterparts in year-over-year price gains, creating a mix of market behaviors that indicates the housing market overall is normalizing rather than heading for a crash. Las Vegas, Phoenix and Tampa, Fla., reported the highest year-over-year gains in the 20-city composite index, which climbed 3% year-over-year, down from 3.5% in January. Las Vegas rose 9.7% year-over-year, followed by Phoenix at 6.7% and Tampa at 5.4%.

The slowdown reflects the wider range of inventory that buyers had available this winter, which gave them more breathing room around prices than they have had in a while. Buyers might be lured by falling mortgage rates heading into spring, although rates have been low for so long that they no longer spur the kind of intense demand that drives up prices.

Below is Zillow’s Case-Shiller forecast for March. It’s scheduled for release on May 28.

The post February Case-Shiller Results and March Forecast: Home Price Growth Slowest Since 2012 appeared first on Zillow Research.


via February Case-Shiller Results and March Forecast: Home Price Growth Slowest Since 2012

Mortgages Are Getting Riskier Again: Should We Be Worried?

9 Homes on the National Register of Historic Places for Sale Right Now

Prices Are Cooling, But a Wave of Potential Buyers Is Coming Soon

If you thought there were a lot of first-time home buyers over the past 10 years, check out what's coming: An extra 3.11 million people at prime first-time home-buying age. From 2019 through 2028, 44.9 million people will turn 34, the median age of current first-time home buyers. That's an increase of 7.4% from the past 10 years, when 41.8 million people passed that threshold. And while we can't say for sure whether the younger group will buy homes as readily when they hit their mid-thirties, by the sheer heft of their numbers, they will have an impact on the market.

Millennials hold such fascination partly because they are a massive generation, and that generational heft has yet to fully hit the home-buying market. The largest 3-year cohort in the U.S. is only 24 to 26 years old, yet the median age of the first-time home buyer is 34.

To imagine the scale of the millennial generation's impact on housing, let's look at the size of the U.S. population ages 35 to 44 relative to the cohort aged 24 to 33. We'll call the older set "past first-time home buyers" and the younger set "up-and-coming" first- time buyers. There are 3.11 million more up-and-coming than past first-time home buyers.

The relative size of the up-and-coming group is important for a few reasons:

Prices will climb quickly again

It's a comforting idea in a quickly cooling housing market that there is significant structural, long-term demand moving into home buying. This increases our confidence that the slowdown will correct itself before too long. The current home value declines in some expensive markets can be seen in this light as an important reset for down payment affordability for home buyers of the future.

Dearth of inventory pushing up the age at which people first buy

It suggests that the median age of the first-time buyers will continue to be pushed further and further out. The rate of single-family construction is still behind the pace of building we experienced back in the '90s, a more "normal" time in housing when home values and incomes took turns in the lead. Without an increase in truly new supply, we will need boomers to start downsizing in earnest to lubricate the housing market. As it currently stands, boomers are more often aging in place, contributing to low inventory numbers.

Rents will keep climbing, too

Younger generations' persistence in the rental market will continue to put pressure on those markets despite all the new apartment building. This is a huge generation and the rate of multifamily building, as aggressive as it seems for anyone watching the skylines of urban areas, does not make up for years' worth of shortfall when more capital was being directed to single-family building during the housing bubble.

Jumping down to the metro level, the pressure implied by the relative size of "up-and-coming" and "past" first-time homebuyers varies greatly. In Boston or San Diego, for example, there are almost 20% more people in the younger  than the older cohort.

Indeed, in  45 of the country's largest 50 metros, there are more potential first-time home buyers at the younger end of the pipeline. The only markets where that's not true are Charlotte, Washington, D.C., Atlanta, Raleigh, N.C., and Portland, Ore.. The relative affordability of Charlotte and Raleigh, along with the lower demographic pressure on housing needs, could influence migration from expensive, high-pressure markets that will likely be unable to facilitate the homeownership of many residents.

Consider San Francisco, for example. A notoriously expensive place to live, the median age of first-time home buyers in the San Francisco metro is 37. Looking at the shape of the San Francisco age distribution relative to the nation, San Francisco has more than its fair share of 27- to 36-year-olds, but under indexes on late-Gen Xers, young boomers, and teenagers. When families start to need more space for privacy loving teens, when they're searching for high-quality public high schools-and when they want both of those things affordably, they leave.

Time will tell whether the potential "up-and-coming" first-time home buyers buy homes at a similar rate as those who came before, or if they have to move to more affordable ground to make that happen. The life cycle of housing is intimately tied to the life cycles of our population. From this quick glance at the age distribution of the U.S. and major metro areas, what we do know is that challenges are ahead.

Methodology

Population counts by age and metro were pulled from 2017-ACS data made available by IPUMS – USA. Ages of individuals were bumped up one year to coincide with our source for median age of first-time buyer, the 2018 Zillow Group housing trends report. Median age of first-time home buyers was estimated at the national and regional level. While the median age of FTHBs by region matches the U.S. in the Northeast and Midwest, it increases to 36 in the South and decreases to 33 in the West. Due to sample boosting in five major metros, more local estimates of median age of first-time home buyers is available Atlanta (37 years old), Chicago (34 years old), Washington, D.C. (34 years old), Phoenix (34.5 years old), and San Francisco (37 years old).

The post Prices Are Cooling, But a Wave of Potential Buyers Is Coming Soon appeared first on Zillow Research.


via Prices Are Cooling, But a Wave of Potential Buyers Is Coming Soon

Monday, April 29, 2019

Real Estate Listings With Gun Rooms? The Pros, Cons, and Perils Revealed

America’s Top-Selling Home Decor Items Made Us Do a Double Take

DIY Backyard Fire Pit: Build It in Just 7 Easy Steps

Turn your backyard into a cozy camp spot by making your own fire pit. This DIY project is easy to complete, and you'll be making s'mores around the fire in no time.

Get ready

Before you begin building, consult your local fire code to see if fire pits are allowed in your city and, if so, how far away the fire pit has to be from a structure.

Then, gather your supplies:

  • Bricks for the fire pit wall
  • Gravel
  • Twine or string
  • Tape measure
  • Stake
  • Large shovel
  • Trowel
  • Tamp
  • Level

When purchasing bricks for the fire pit wall, go for something sturdy like retaining wall bricks or concrete pavers. Some home improvement stores even carry bricks specifically designed for fire pits. Use a layer of firebricks, which have a higher heat resistance, on the inner layer of the fire pit as an extra safety measure.

Now that you have all your supplies and you’ve checked your local fire code, you’re ready to build!

1. Create a circle

Pick a spot for your fire pit (ensuring that it is located a safe distance from any structures, bushes or trees) and insert a stake in the ground where the center of the pit will be.

Tie one end of the string or twine to the stake and measure how wide you want your circle to be.

Typically, a fire pit has a diameter of about 4-5 feet. Cut the string and tie the other end to the handle of a trowel. With the string or twine taut, drag the sharp end of the trowel around in a circle, creating a line in the grass.

2. Shovel out the grass

Using a large shovel, dig out the grass inside the circle.

For safety purposes, the hole for a fire pit should be about 6-12 inches deep. Be sure to call 811 before you start digging to ensure there are no utility lines buried under the spot you’ve chosen.

3. Tamp down the dirt

If you don't have a tamp, you can just use the bottom of your shovel.

4. Make sure the circle is level

Get down on the ground with your level to ensure that the surface is ready for the bricks. Keep making small adjustments until it's completely level.

5. Add gravel

Put a pretty thick layer of gravel in the fire pit (at least a couple of inches). Spread the gravel around evenly.

6. Arrange the bricks

After you've spread the gravel around, arrange your bricks in a circle and stack them in layers until the fire pit wall is at least 12 inches tall.

For extra safety, you have the option to put an inner layer of firebricks. Though you don't need to use mortar if the bricks are heavy enough to make a sturdy stack, you can use an outdoor fire-resistant mortar between the bricks for extra stability.

7. Relax and enjoy!

Gather a couple of Adirondack chairs, some firewood, a few friends and campfire treats to get full use out of your new fire pit.


Related:

Originally published July 19, 2017.


via DIY Backyard Fire Pit: Build It in Just 7 Easy Steps

Marriott to Take On Airbnb in Booming Home-Rental Market

Launching Pads: America’s 10 Best Starter Cities for New College Grads

Friday, April 26, 2019

10 Cozy and Affordable Beach Houses for Sale in the U.S. Right Now

Get the sunscreen ready!

The post 10 Cozy and Affordable Beach Houses for Sale in the U.S. Right Now appeared first on RE: Find.


from 10 Cozy and Affordable Beach Houses for Sale in the U.S. Right Nowhttps://http://bit.ly/2Vs1sA1

Heroic Homes Where the Avengers Can Chill While Awaiting Their Endgame

Once a Squatter’s Haven, San Francisco’s Mini-Versailles Gets a Multimillion-Dollar Makeover

Got a Buck? It’s All You Need to Bid on This Week’s Most Popular Home

Thursday, April 25, 2019

‘Extraordinary’ $26.5M Tuscan-Style Estate in Napa Valley Is the Week’s Most Expensive Listing

Poor Baby! 10 Nursery Design Fails So Odd, They Boggle the Mind

Q1 2019 Homeownership Rate:

  • The Q1 2019 U.S. homeownership rate was 64.2%, down slightly from 64.8% in Q4 2018 and virtually unchanged from Q1 2018, according to the U.S. Census Bureau.
  • The rental vacancy rate of 7% was virtually unchanged from the rate in the Q1 2018, but 0.4 percentage points higher than the Q4 2018 rate of 6.6%.

With the national homeownership rate essentially flat from a year ago, it remains just slightly below the historic average of 65.2% dating back to the 1960s. It's still a ways off from the all-time highs approaching 70% set in the early 2000s, but in hindsight those lofty peaks may not have been sustainable.

The quarterly decline in homeownership is shared across all ages, but is most disappointing for those in the under 35 and 35-to-44-year-old age brackets, the two groups driving the homeownership rate gains over the last few years. Anemic homeownership rate growth among younger buyers signals the difficulties many of those buyers continue to face in securing a down payment, finding a home in their budget or qualifying for a loan. These hurdles – combined with potential shifts in preferences and/or a simple delay in the many "adulting" events like marriage and children that precipitate buying a home – can have the effect of keeping younger, would-be buyers in rental housing for a longer time. This rental market persistence, coupled with the sheer size of the 20-and-30-something population, is keeping rental vacancy rates low at 7% nationally and puts upward pressure on rents themselves. Multifamily permitting activity has been high in recent years, but the reality is that as much as it feels like we’re building abundant rental units, it’s not enough to make up for a decade-long shortfall experienced during the housing boom, bust and early recovery. Continued gains in homeownership will rely on more renters finding ways to clear these increasingly high hurdles. It's unclear they will.

The post Q1 2019 Homeownership Rate: appeared first on Zillow Research.


via Q1 2019 Homeownership Rate:

‘I Helped Renovate the “Brady Bunch” House’: Behind the Scenes With Jasmine Roth

How the Housing Bust Widened the Wealth Gap for Communities of Color

  • Homes in black and Hispanic communities were 2 and 2.5 times as likely, respectively, to experience foreclosure than white communities nationwide between January 2007 and December 2015.
  • Foreclosed homes in communities of color experienced a more dramatic plunge in value when the housing bubble burst, relative to foreclosed homes in white communities and all homes nationwide.
  • Homeowners who were able to hold on through the housing bust-disproportionately those in white communities-saw equity in their homes increase rapidly in its aftermath.

When the housing market went bust, homes in communities of color were disproportionately more likely to succumb to foreclosure than homes in white communities. These homeowners not only lost their biggest asset-their home-but they also missed out on the opportunity to amass wealth throughout the subsequent recovery as home values climbed back upward.

At the same time, those who were able to hold onto their homes through the worst of the housing bust have mostly seen their wealth increase as their homes' values have largely surpassed their housing-bubble peaks. This difference in fortunes, both literal and figurative, across racial and ethnic communities illustrates the ways in which the Great Recession helped exacerbate wealth inequality.

Most people's single-largest asset

For most people, a home is the single largest asset they own in their lifetime. In 2016,[1] a home accounted for just over half (42.1%) of the typical U.S. homeowner's total wealth. But for homeowners of color,[2] their home has and continues to account for a much larger share of their net worth. For the typical Hispanic and black homeowner, their home accounts for the majority of their wealth (64.7% and 55.6%, respectively), while a home accounts for just over a third (38.1%) for the typical white homeowner.


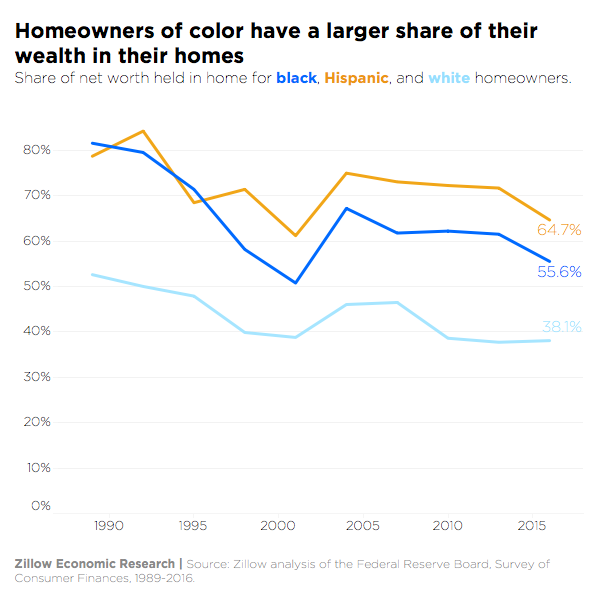
In 2007, near the height of the housing bubble, a home accounted for 73.1% and 61.8% of the typical Hispanic and black homeowner's total wealth, respectively, compared with just 46.5% for the typical white homeowner. Since their homes accounted for such a large share of their wealth, homeowners of color were more exposed to the foreclosure crisis that accompanied the housing market crash as home values plummeted. With fewer assets to draw on, it was harder for them to hold onto their homes if and when their homes fell underwater-meaning, they owed more on their homes than the homes themselves were worth.

Disproportionate foreclosures in black and Hispanic communities

As home values fell after the housing bubble popped, homes in communities of color were more likely to be foreclosed upon than white communities. Of all the homes foreclosed upon between January 2007 and December 2015,[3] 12.7% and 19.4% occurred in predominantly black and Hispanic communities, respectively. To put that into perspective, only 7.7% and 9.6% of all homes are located in predominantly black and Hispanic communities. Whites, however, fared better-66.4% of all foreclosures occurred in predominantly white communities. While that may sound like a high share of all foreclosures, it's because the vast majority of homes (81.2%) are located in predominantly white communities.[4] In other words, homes in black and Hispanic communities were 2 and 2.5 times as likely to succumb to foreclosure as homes in white communities.

In certain metro areas, communities of color fared even worse. In San Francisco, for example, 4.6% and 38.1% of housing bust foreclosures occurred in black and Hispanic communities, respectively, compared with 43.5% in white communities. To put this into perspective, just 2% and 16.5% of all homes in San Francisco metro area are located in black and Hispanic communities, while 62.3% of all homes are in white communities. Together, this means that black and Hispanic communities experienced a rate of foreclosure that was 3.3 times as high as white communities.

A thinner financial cushion

Part of the reason that homes in communities of color experienced higher rates of foreclosure is because home values plunged more dramatically in those areas during the recession. As home values fell, negative equity-when a home is worth less than the amount owed on it, making it difficult if not impossible to sell or refinance-skyrocketed. Homeowners in negative equity are more likely to be foreclosed upon, especially those in deep negative equity that might see little point in throwing good money after bad just to stay in a home they may realistically have little to no hope of one day selling for a profit.

As the recession continued to unfold, layoffs and unemployment spiked, which left many people out of work for years and forced others to accept lower-paying jobs than they previously held just to make ends meet. This was especially damaging for people of color, many of whom typically have a more difficult time absorbing financial shocks like loss of employment and unexpected expenses. Just over a third of blacks and Hispanics (35% and 38.2%, respectively) have an emergency or rainy day fund that would cover their expenses for three months in case of sickness, job loss, economic downturn or some other emergency. For whites, that figure is 55.2%.[5] Part of the reason for the disparity is that blacks and Hispanics earn less than whites, at the national level.

Foreclosure does more than strip the title of a home away from a homeowner: It also strips away any and all wealth a homeowner had in the home, both invested up front in the form of a down payment and accumulated over time through home value appreciation and built-up equity. In the lead-up to the housing bubble, homeownership peaked for all races and ethnicities, making the subsequent crash and foreclosure crisis even more devastating for newly minted homeowners.

Those who lost their homes to foreclosure also were forced to re-enter the housing market as renters. The sudden new demand for rental housing caused rents to soar throughout the recession, so homeowners that were foreclosed upon-regardless of racial or ethnic group-were putting a larger portion of their income towards rent every month. But communities of color took the largest hit: The typical renter of color spent upwards of 40% of their income on rent each month. Even worse, these once-homeowners were never able to realize the sometimes huge increases in their homes' values during the recovery.

Missing wealth accumulation during the recovery

Homes that succumbed to foreclosure fell dramatically in value. Foreclosed homes in black and Hispanic communities lost more than half (54.5% and 59.2%, respectively) of their value from the height of the housing boom to the bottom of the crash. Foreclosed homes in white communities fared slightly better-falling in value by 35.8%. For comparison, the typical (that is, not foreclosed) home nationwide lost just over a quarter of its value (25.8%).

After the national housing market hit bottom, home values started rising quickly again across the board. Although the typical foreclosed home in communities of color has yet to return to its housing-bubble peak, it has more than doubled in value throughout the recovery, growing 109.2% and 122% in black and Hispanic communities, respectively. Foreclosed homes in white communities have also experienced tremendous, though less precipitous, growth (71.6%), and are currently worth 10.1% more than they were during the peak of the bubble. Over the same time, the typical U.S. home-which didn't succumb to foreclosure-grew 52.5% and is currently worth 13.1% more than it was before the recession. The values of foreclosed homes in communities of color continue to grow-at a whopping 20.2% over the past year in predominantly black communities and 9.1% in largely Hispanic communities, even as the national housing market slows to 6.6% year-over-year, which is a testament to all of the value-and wealth-those once-homeowners could have earned.

In some of the large markets that have had very robust recoveries, the values of foreclosed homes in communities of color have far surpassed their pre-recession peaks. In Los Angeles, foreclosed homes in black and Hispanic communities are currently worth 12.6% and 1.7% more than they were at the peak of the bubble. In Atlanta, these homes are worth 2.1% and 24.5% more, respectively.

Losing more than a roof

If foreclosed homeowners had been able to hold on, they would have been able to see their home's equity – and therefore their wealth – increase. For homeowners of color, this would have been a large share of their wealth.

And finally, even if a previously foreclosed-upon homeowner had been able to accumulate new wealth through savings or other assets after their foreclosure, laws often prohibited many of them from reinvesting that wealth back into housing for seven years, thereby causing them to miss out on large gains in home values over the past several years.

Wealth inequality and racial disparities have been at the forefront of discussion as the nation climbs out of one of its greatest recessionary periods, and for good reason. The gap across racial and ethnic lines in the U.S. worsened throughout the housing bust and foreclosure crisis that followed, as millions lost not only the roof over their heads, but the wealth – and the opportunity to potentially build more – that came with it.

Methodology

Zillow identified racial and ethnic communities at the census-tract level based on racial pluralities. Once census tracts were categorized as predominantly black, Hispanic, or white, we mapped Zillow's proprietary dataset of home values and housing information to these communities to identify where foreclosures occurred between January 2007 and December 2015. We also tracked changes in home values over time. We then aggregated census tracts up to the metropolitan area and national level.


[1] The latest year for which data from the Survey of Consumer Finances is available.

[2] This research focuses on communities that are predominantly black or Hispanic (collectively, “communities of color”) or white. The U.S. Census Bureau also provides data on other racial groups like Asians, but given their relatively small share of the population, they have mostly been excluded from this analysis.

[3] This analysis focuses on foreclosures between January 2007 and December 2015 to encapsulate the period when foreclosure rates were highest. Prior to the bust, U.S. median home values peaked in May 2007, but the peak was earlier in some markets. Similarly, even though the national housing market bottomed out in February 2012, the impact of the bust and recession lasted much longer. Homeowners who attempted to hold onto their homes throughout the recovery were sometimes unsuccessful, which continued the trajectory of steady foreclosures through 2015. In 2016, foreclosure rates began to level off, signaling the end of the foreclosure crisis.

[4] This analysis does not suggest that black or Hispanic residents-or residents of some other race-can't or don't live in largely white communities, or vice versa; they certainly can, and almost always do. In fact, this is true in 99.5% of all predominantly white communities across America. However, in the 72,725 communities analyzed, 75% were considered to be predominantly white, 10.3% predominantly black, and 12.7% predominantly Hispanic. The remaining share of communities were classified as either predominantly Asian/Pacific Islander or some other race. Because so many more communities are classified as predominantly white, it follows that so many more homes themselves would also lie within these communities.

[5] Zillow analysis of the Survey of Household Economics and Decision-making, 2017.


The post How the Housing Bust Widened the Wealth Gap for Communities of Color appeared first on Zillow Research.


via How the Housing Bust Widened the Wealth Gap for Communities of Color

Wednesday, April 24, 2019

Most popular homes and their neighborhoods of April 2019

Need a New ‘Fixer Upper’ Fix? Try These Chip and Joanna Gaines Parodies for a Laugh

Tuesday, April 23, 2019

4 Questions to Ask Before You Gut a House

Saving what you can should be a priority.

The post 4 Questions to Ask Before You Gut a House appeared first on RE: Find.


from 4 Questions to Ask Before You Gut a Househttps://http://bit.ly/2L7xtJw

March New Home Sales: Back on Track

  • New homes sales climbed 4.5% in March, to 692,000 units (SAAR) from February, according to the Census Bureau. They were 3% higher than a year ago.
  • The median price of new homes sold in March was $302,700 (non-seasonally adjusted), down 4% from February and down 9.7% from a year earlier.
  • Inventory dropped 0.3% from February 344,000, and rose 15.8% from a year earlier.

On the heels of a disappointing existing home sales report, the underlying fundamental strengths of the housing market came through clearly in March’s new home sales figures. A strong labor market and sharp mortgage rate declines last month clearly drove buyers into the hands of builders — and importantly, buyers at a variety of price points. Sales in the critical $200,000-$299,000 segment grew from just about a quarter of all sales a year ago (28%) to more than a third in March (34%). Sales volumes through Q1 are higher than at this point last year — and the start of 2018 was strong in itself — and the bump is happening despite still-rising costs of land and lumber. The typical sales price for a new home remains higher than the national median for all homes, but it appears builders are finally proving able to meet buyers at more affordable segments — critical to continued strength.

The post March New Home Sales: Back on Track appeared first on Zillow Research.


via March New Home Sales: Back on Track

Home Value Cooling Is More About Changes in Demand Than Supply (March 2019 Market Report)

The market has begun to cool, with the median home value nationally climbing in March by less than 7% annually (to $226,700) for the first time in more than two years.

Home values are growing especially slowly in some markets that until recently were among the country's hottest. While values in most major metros continue to climb, but slowly, an exception is pricey San Jose, Calif.: Its home values fell year-over-year in March for the first time in seven years, falling 0.2% from March 2018 (the median home in the San Jose area was worth $1,209,700 in March, down from $1,212,100 a year ago).

While long-term housing demand continues to look strong, we're seeing our first set of significant local housing slowdowns since the nationwide downturn in 2007. Other formerly white-hot markets that are jamming on the brakes include: San Diego, where home values grew just 1.3% annually in March (down from 8.6% year-over-year growth in march 2018); San Francisco and Los Angeles, both growing at 2% year-over-year, down from 9.5% and 7.6% last year; and Seattle,  growing at a 2.6% annual pace, from 11.8% a year ago. Judging by their trajectory, it is possible home value appreciation will continue to soften and go temporarily negative in these markets as well.

It's not surprising that the total inventory of homes available for sale during the month is simultaneously climbing. March was the seventh consecutive month of year-over-year inventory gains-the first time that's happened since 2014.

However, these sister trends-home values falling and overall inventory climbing-are not a result of builders or homeowners putting more houses on the market, although it may feel that way to new buyers checking on available listings and seeing more from which to choose.

In fact, for the past four months, new for-sale inventory – the number of homes listed in a given month that were not on the market during the previous month – has fallen on an annual basis. In March, there were 6.1% fewer new listings than in March 2018; in February, 7.7% fewer; in January, 3.6% fewer; and in December, 2.8% fewer.

Although there have been months with annual increases-notably October, when new listings rose 13.4% from a year earlier-the trend is downward, a sign that even sellers are retreating from the housing market.

Without an influx of new listings, the boost in total inventory has been largely a result of changing demand:

  • Buyers are more willing to wait: February was the first month in four years (since February 2015) that the average number of days listings are on the market has risen. In February, listings nationally were on the market for an average of 96 days, up from 92 days a year earlier.
  • They're also less willing to pay sellers' asking prices: In March, 14.6% of listings had a price cut, up from 12.7% in March 2018.

This kind of slowdown story is typified by markets like Sacramento, Chicago, Riverside, Calif., Tampa, Fla., Dallas-Fort Worth,  and Los Angeles-major metro areas where home value appreciation is significantly slower this year than last and overall inventory is up despite a drop in the number of new listings this March versus last March.

Slowdowns driven by an influx of new supply can be welcome news for certain types of housing markets, like rain after a long drought. And there are metros having that kind of breather–San Jose and Seattle, the two metro areas with the most abrupt slowdown in home value appreciation, are experiencing swells in overall inventory bolstered at least in part by increases in new listings. Denver, Boston, Detroit, and San Antonio have similar profiles, but with more gradual softening in price growth.

The Atlanta metro is an odd exception. Like the above, overall inventory and new listings are significantly higher, up 13.8% and 14.8% respectively, yet home value appreciation remains on par with last year, growing in the double digits.

On the other end of the spectrum, Indianapolis, Virginia Beach, and Austin continue to experience both increasing appreciation and declining inventories-a good reminder that the national trend no longer typifies all markets' experience.

Non-coastal metros take off

While expensive coastal markets experience a home-value slowdown, values in inland markets including Indianapolis, Atlanta and Las Vegas are posting double-digit growth. Annual growth in Indianapolis has been climbing in the double digits for eight months, and rose 12.8% in March to $167,000, the fastest of any major market. Atlanta's median home value grew 10.7% in March to $220,000, which puts it just shy of the $226,700 national median. And Las Vegas posted 10% median home value growth in March to reach $280,600. While most major metros have by now reclaimed their housing bubble peaks, it will still be a while before Las Vegas reclaims its June 2006 peak of $316,800.

Rents keep climbing

The median rent nationwide rose 2.5% ($36) in March to $1,474 a month. Among major metros, rents climbed fastest year-over-year in Las Vegas, where they rose 7.6% ($98) to $1,396; Phoenix, where they were up 6.7% ($91) to $1,446; and Orlando, Fla., where they grew 6.5% ($93) to $1,531.

Rents rose 2% or less in nine of the 35 largest metro areas. Baltimore grew the slowest, climbing 1% from March 2018 ($18) to $1,753. It was followed by San Jose, Calif., and the New York metro area, where rents rose just 1.5 percent from a year ago (to $3,553 in San Jose and $2,419 in New York).

The post Home Value Cooling Is More About Changes in Demand Than Supply (March 2019 Market Report) appeared first on Zillow Research.


via Home Value Cooling Is More About Changes in Demand Than Supply (March 2019 Market Report)

Say ‘Hola’ to 9 Spanish-Style Homes on the Market—All Priced Under $400K

Monday, April 22, 2019

7 Ways to Celebrate Earth Day Year-Round With Eco-Friendly Items at Home

Chip and Joanna Gaines Designed That?! Their Worst ‘Fixer Upper’ Fails Revealed

March Existing Home Sales: Step Back, But Still Moving Forward

  • Existing home sales dropped 4.9% in March from February, to 5.21 million sales (SAAR), according to the National Association of Realtors. Sales were down 5.4% from a year ago.
  • Inventory at the end of March was 1.68 million, up 3.1% from February and 2.4% from a year ago.
  • The median (non-seasonally adjusted) price of existing homes sold in March was $259,400, up 3.8% from a year earlier.

Despite the step backward from February's release, today's report still paints an encouraging picture for the housing market. February's exceptionally strong report – which showed sales increased 11.8 percent from January – may not have been a beacon of future sales. The housing market is still recovering from a dismal fall and winter, where home sales stalled amid climbing mortgage rates, poor stock market performance and a government shutdown. While today's figures show a slight pullback from February, the overall trend still shows a market that is improving and prepared for more growth. What's more, with mortgage rates remaining low, home purchase applications continue to rise, suggesting that this gradual recovery in home sales will continue as we head into spring.

The post March Existing Home Sales: Step Back, But Still Moving Forward appeared first on Zillow Research.


via March Existing Home Sales: Step Back, But Still Moving Forward

Airbnb Bliss: Top 10 Cities Where Vacation Rentals Rake in the Most Cash

Friday, April 19, 2019

Thieves Plunder Barns for Precious Loot: Farmhouse-Chic Wood

Which Listing Features Could Help Your House Sell for More?

The features you choose to highlight in your for-sale listing can have a big impact on how fast your home sells and for how much. Below is a roundup of how much more homes sold for when their listings mentioned certain features.

We're not saying you should build or add these things to your home just to help it sell. We're also not saying that it's necessarily these features that account for the price boost. It could be that homes with steam ovens also have amazing kitchens that create a sweet sale-price premium.

However, listings that mention these features do sell for more-sometimes a lot more. So if you have any of these items already, when you're writing that listing is the time to flaunt it.

Listings that mention these features sold for more than expected:

Feature in listing % above expected price that homes sold for
Steam oven 34.1%
Professional appliance 32.3%
Wine cellar 31.4%
Steam shower 30.7%
Pot filler 27.5%
Shed/Garage studio 26.5%
Heated floor 26.2%
Waterfall countertop 26.0%
Outdoor kitchen 24.5%
Prep sink 24.1%


And listings with these features sold faster than expected:

Feature in listing How many fewer days homes took to sell
Open shelving 11.2
Pergola 10.7
Mid-century 10.7
Subway tile 10.4
Exposed brick 9.5
Smart light 8.9
Farmhouse sink 8.9
Butcher block 8.8
Smart thermostat 8.2
Barn door 8.1


Methodology

We analyzed 4.6 million home sales across the country completed in 2017 and 2018. Sale price and days on Zillow were separately regressed on controls for home size, age, ZIP code level average home values, MSA-level home value trends, the year and quarter in which the home sold, the broad price tier of that home within the MSA, and an indicator for the presence of each feature in the listing description.

The post Which Listing Features Could Help Your House Sell for More? appeared first on Zillow Research.


via Which Listing Features Could Help Your House Sell for More?

March Housing Starts: Still No Momentum

• March housing starts fell 0.3% from February and 14.2% from a year ago, to 1.14 million units (SAAR) according to the Census Bureau-their lowest level since May 2017.  Single-family starts dropped 0.4% from February and 11% from a year ago; multifamily starts were down 3.4% month-over-month and down 21.8% year-over-year.
• Housing permits fell 1.7% from February and were down 7.8% from a year ago.
• National housing completions dropped 1.9% from February but climbed 6.8% from a year earlier.

Housing starts continue to flounder following hard knocks over a winter marked by the partial government shutdown and brutal weather. The Midwest had the largest declines, likely attributable to the floods that part of the country has experienced. This lackluster March report is a surprise, with housing starts still not regaining the momentum expected from lower interest rates, a strong labor market and other bullish economic signals.

In an industry that maneuvers with the deliberation of a big tanker, it can take a while for builders’ confidence in the market to appear as housing starts. The March numbers show better economic conditions still are not bearing fruit for builders as the market turns toward the spring home shopping season.

The post March Housing Starts: Still No Momentum appeared first on Zillow Research.


via March Housing Starts: Still No Momentum

Philly Home on America’s Oldest Residential Street Is the Most Popular This Week

Thursday, April 18, 2019

$30M Oregon Ranch With 40,000 Acres Is the Week’s Most Expensive New Listing

Same-Sex Couples 73% More Likely to Be Denied Mortgages, Study Finds

Mortgage Rates Continue Ticking Up as Spring Home Buying Season Heats Up

I Accidentally Bought a Marijuana Grow House: Why Even Weed Lovers Should Be Very Afraid

Wednesday, April 17, 2019

LGBTQ Neighborhoods where locals love to live

Sanctuary: An Astronomer's Home Observatory

Jonathan Fay lives a double life. By day, he works in software engineering, but once the sun goes down, he opens a window to the heavens - right in his own backyard.

The amateur astronomer designed and built an observatory behind his Woodinville, Washington, home to house his 12-inch telescope. There, he gazes at planetary nebula and photographs galaxies. For Fay, having his own sanctuary is out of this world.

How would you describe your sanctuary?
My observatory is a place of peace where I can collect my gear and spend time with the universe. The nature of astronomy in the Pacific Northwest is challenging, but I’m able to open the dome and start observing without having to set up ahead of time and rush to cover things up when it rains.

What do you like best about the physical space?
It’s separate from the activity of my home, and it’s quiet. I don't disturb anyone else, and they don't disturb me.

What's your home like? Is your sanctuary an extension or departure from your home?
Our home is a two-story wood and brick home. The observatory blends nicely with the house and barn in style, but the dome clearly sets it apart.

Did you have your sanctuary in mind when you chose your home?
No. A few years after I moved in, I realized I needed a more permanent place than a second-floor porch off the bedroom to set up my new telescope.

What was the tipping point that made you decide to create a sanctuary?
When I would do astrophotography imaging runs on the second-floor porch, people would turn on lights or walk around, and the light and vibration would ruin the image. My wife didn’t like having to shut down her life for my hobby.

How did you build your sanctuary?
I designed and built the observatory. I had some occasional help from friends when I needed lifting or a second pair of hands. I also had help from my kids handing me screws and nails while I worked.

Sanctuary_Fay_exterior_05

What was the biggest challenge in creating your sanctuary?
Round stuff is hard. Especially when it has to rotate and be level. The dome was a hemisphere, so it was round in more than two dimensions. Woodworking tools are not optimized for round things.

Has your sanctuary always looked the same, or has it changed over time?
We recently added wood floors from carpet. And we put on a new roof when we re-roofed the rest of the buildings on the property.

How much time do you typically spend in your sanctuary?
Sometimes many hours for several days in a row. Sometimes I go weeks without going inside. It depends on the ebb and flow of life - and how bad I need it.

How did you get into astronomy in the first place?
My aunt gave me a telescope when I was about 12. Since then I have loved space and astronomy, but when I could put a computer-controlled camera on a telescope, that made me want my own Hubble in my backyard.

Sanctuary_Fay_interior_01

Does your hobby influence what you do professionally or vice versa?
Building my observatory, writing all the software for it, and doing astronomical imaging helped me create the WorldWide Telescope project with two of my co-workers. Now millions of people can visit space on their computer or planetarium because of it.

Do you share your sanctuary with anyone? What about your home?
I will share the observatory with just about anyone who asks, and sometimes I invite people to join me. I share my home with my wife and five active kids. So sometimes a getaway is in order!

Sanctuary_Fay_portrait_08


If you had a do-over, would you change anything about your sanctuary?
While I love the look of the dome, I would make the shutters open wider to accommodate a bigger telescope.

Do you wish you had found your sanctuary sooner?
It came at the right time for me, and I returned to update it when that time was right.

What advice would you share with those who dream of having a sanctuary someday?
You’re not getting any younger. Just go for it, even if you don't use it as much as you think you need to to justify the cost. It will always be a great story to share.

Related:

Originally published July 2016.


via Sanctuary: An Astronomer's Home Observatory

Sleep Under the Stars in a Bubble Home

Many Millennials Are Putting Off These Milestones Until They Buy a Home

This Tiny Home Is Ready for Outer Space

Ground control to Major Tom: Here's a home unlike any other we've seen.

A lifelong architect went intergalactic to find inspiration for one of his latest designs: a tiny home shaped like a lunar lander.

Nestled on the banks of the Columbia River in central Washington, the roughly 250-square-foot home is hexagon-shaped, perched nearly 9 feet above the ground on three massive steel beams.

Inside, earthlings are greeted by an open floor plan. A breakfast nook has a porthole-shaped window overlooking the river and the hillside; a kitchen with stainless steel appliances provides space to cook up a feast for an astronaut.

A large geodesic dome skylight showers the room with sunlight.

Just off the bathroom, a deep-blue sink and cerulean-colored mirror have a Mid-Century Modern feel (appropriate, considering humans first walked on the moon in 1969).

The bedroom sits below a small ladder and can comfortably sleep two people. 

Upstairs, there's enough room for a small outdoor deck where you can gaze at area wildlife, including eagles and lynxes.

If the space reminds you of the tiny well-intentioned living quarters of a boat, it's no coincidence. The lunar lander's owner and designer, Kurt Hughes, is a boat designer by trade.

He translated his three decades of boat building to home building - in fact, the wooden table in the dining nook is recycled from the Hughes' first sailboat.

Beam us up, Scotty.

Photos by Zillow’s Marcus Ricci.

Related:

Originally published May 2018.


via This Tiny Home Is Ready for Outer Space

Tuesday, April 16, 2019

What Happens to Your Credit Score When You Close a Credit Card?

The answer may surprise you!

The post What Happens to Your Credit Score When You Close a Credit Card? appeared first on RE: Find.


from What Happens to Your Credit Score When You Close a Credit Card?http://bit.ly/2VS3Dd6

4 Questions to Ask Yourself Before You Refinance Student Loans

Do you know what type of loan you have?

The post 4 Questions to Ask Yourself Before You Refinance Student Loans appeared first on RE: Find.


from 4 Questions to Ask Yourself Before You Refinance Student Loanshttps://http://bit.ly/2PdEHu9

3 Reasons Why Taking Money out of a 401(k) Isn’t Worth It

Seriously consider before you pull the trigger.

The post 3 Reasons Why Taking Money out of a 401(k) Isn’t Worth It appeared first on RE: Find.


from 3 Reasons Why Taking Money out of a 401(k) Isn’t Worth Ithttps://http://bit.ly/2KJVNRO

Reversal of Fortune: The Mortgage Mistake That Could Cost One Woman Her Longtime Home

How to Save Money on the 3 Biggest Wedding Expenses

Do you need a professional photographer?

The post How to Save Money on the 3 Biggest Wedding Expenses appeared first on RE: Find.


from How to Save Money on the 3 Biggest Wedding Expenseshttps://http://bit.ly/2Pdsu8z

Cool Centennial! 10 Homes Built in 1919 Prove Age Is Nothing but a Number

Homes With Solar Panels Sell for 4.1% More

Not only can adding solar panels to a home save energy costs and help the environment, it also can potentially increase a home's value. During the past year, homes with solar-energy systems sold for 4.1% more on average than comparable homes without solar power. For the median-valued home, that translates to an additional $9,274.

The sale premium varies substantially by market. In Riverside, Calif., for example, homes with solar-energy systems sold for 2.7% more than comparable homes without solar power-a markup of $9,926 for the median-valued home in the metro. In the greater New York City metro, solar-powered homes have a premium that is double that of Riverside. At 5.4%, that's an extra $23,989 in value for the typical home in New York.

In three other coastal metro areas-Los Angeles, San Francisco and Orlando, Fla.-homes with solar power can fetch a premium of around 4%.

One reason houses with solar-energy systems sell for more than those without them is because they can provide substantial future energy cost savings. For homeowners who know they consume a lot of power, these future savings are worth spending a bit more money up front. It is also possible that homes with solar-energy systems are more likely to have other features that are hard to measure yet valuable, like heated floors, which could contribute to the premium associated with solar power.

Personal preferences play a role, too: More than 80% of home buyers say energy-efficient features are important, according to the Zillow Group Consumer Housing Trends Report.

Methodology

We calculated the solar premium by comparing homes with and without solar-energy systems that were listed for sale and sold from March 1, 2018 to February 28, 2019, controlling for observable attributes of the homes, including bedrooms, bathrooms, square footage, age of the home and location.

The post Homes With Solar Panels Sell for 4.1% More appeared first on Zillow Research.


via Homes With Solar Panels Sell for 4.1% More

Monday, April 15, 2019

What is a Qualified Mortgage?

'Cause risky lending practices are so 2008.

The post What is a Qualified Mortgage? appeared first on RE: Find.


from What is a Qualified Mortgage?http://bit.ly/2V4sVrh

Jeff Bezos Is Apartment Hunting in NYC—Here’s What the World’s Richest Man Can Buy

America’s 10 Fastest-Gentrifying Neighborhoods: Buy While You Can!

Friday, April 12, 2019

Wish You Lived in a ‘Game of Thrones’-Style Castle? Buy One Right Here

Tax Reform Exacerbates Sales Cooldown in the U.S.

Phil Spector’s Infamous SoCal Chateau Is This Week’s Most Popular Home

Thursday, April 11, 2019

Golfer Greg Norman’s $50M Colorado Ranch Is the Week’s Most Expensive New Listing

Negotiating Closing Costs: 6 Ways to Save Money

Have you researched buyer's assistance?

The post Negotiating Closing Costs: 6 Ways to Save Money appeared first on RE: Find.


from Negotiating Closing Costs: 6 Ways to Save Moneyhttps://http://bit.ly/2UBSOzu

The Most Fabulous Homes for Dogs, Cats, Birds, Bunnies, and Beyond

‘Animal Cribs’ Host Shares His Secrets for Creating Spaces Any Pet Will Love

Wednesday, April 10, 2019

9 Tips for Preparing a Fabulous Flower Bed

Have you ever ended up with a bed of dead flowers, mountains of mulch and a whopping garden center receipt? Let's do something about that, shall we?

Get your gardening groove back with these nine tips.

1. Start with a clean slate

There are two kinds of flower beds: those that have been well-prepared and those that are covered in weeds.

Give your unplanted bed the once-over. Does it get enough sunlight? Does water tend to collect there? Have you removed all weeds, roots and rocks so your plants will thrive? It's a lot easier to fix these problems now than it is once you’ve planted the flowers and laid the mulch.

2. Start seeds

Start a flower bed from seed to save money, raise unusual varieties and enjoy the satisfaction of having grown a whole garden from a handful of tiny seeds.

Since some seeds transplant poorly, check the packet and make sure you don't have to sow directly in the ground. Start seeds in trays, pots or coir pots, using a seedling mixture, place them in a sunny spot, and transplant as soon as they have developed sturdy stems.

3. Prepare nursery plants

Nursery-grown bedding plants give you instant gratification, but the short time between purchase and planting is crucial to their survival.

Pack them closely in your car to avoid damage, and take them home immediately so that they don't fry in your car during other errands.

Water nursery plants as soon as you get home, as often as necessary after that, and a few hours before planting to help their fragile roots survive the trauma of transplanting.

4. Get the winning edge

Even the most carefully planned border can look sloppy without a clearly defined edge. Avoid those inexpensive and quickly deteriorating edges made of plastic, and choose a more natural and long-lasting alternative.

The cheapest solution is to make a shallow trench around the bed with your spade and maintain it throughout the season. For something more refined and permanent, set an edge of brick, concrete or stone in leveling sand. The initial cost may be higher, but they will save you a lot of work and make mowing easier.

5. Plan for the seasons

Choose annuals if you plan on replacing them in a season or two, and plant perennials if you'd like them to last longer. Plant evergreen shrubs or ornamental grasses to provide structure and year-round interest.

Also consider the plant's eventual height. Plant low-growing flowers (usually annuals) at the front of the bed where you can easily view them and replace them at the end of their season.

shutterstock_395790778

6. Give them space

Follow the guidelines on the seed packet or plant tag as closely as possible. An often overlooked factor is the amount of space to leave around each plant so they have room to grow. To cover a lot of ground quickly, choose spreading varieties like Superbells and climbing nasturtiums.

7. Dig the perfect hole

Dig each plant's hole to be twice as wide as the original pot so the roots will have plenty of room to grow. To give them an even better head start, make a little trench around the inside of the hole so the roots will spread down and out.

This step isn't necessary for annuals, since they won't be around long enough to enjoy their strong root systems, but it is helpful if you have clay soil.

8. Plant it right

When planting transplants and nursery plants, always place them so that their crowns (where the plant meets the soil) are level with the soil in the bed. If the crown is above the soil level, the plant may dry out when soil washes away from the roots. If planted too low, soil will settle around the crown and rot the plant.

Push the soil around the transplant and firmly tamp it in place with a trowel so no gaps are left between the roots.

9. Mulch mindfully

Mulch is essential for conserving moisture and preventing weeds, but one inch is all you need. Established garden beds don't even need mulch because the plants themselves are capable of protecting the soil.

Avoid landscaping fabric, since it actually keeps moisture from percolating into the soil. Instead, lay down sheets of newspaper before mulching.

Mulches vary by region, but whichever kind you use, follow this one rule: Don't ever pile it up against the plants. They'll rot in no time, and you'll soon have nothing more than an ugly bed of mulch in their place.

Related:

Originally published April 2016.


via 9 Tips for Preparing a Fabulous Flower Bed

America’s Best City to Live in Is … Seriously? Again?!

Good Clean Fun: How to Build an Outdoor Shower

Old Wood Can Cost More Than New Lumber. People Want It Anyway.

The Hottest Real Estate Markets in America for March 2019: Oh, Ohio?!

Tuesday, April 9, 2019

9 Ways to Tell if a Home Sparks Joy

Can you imagine your future in the home?

The post 9 Ways to Tell if a Home Sparks Joy appeared first on RE: Find.


from 9 Ways to Tell if a Home Sparks Joyhttps://http://bit.ly/2OXbwLA

The Home Feature Millennials Love Most: You’ll Never Guess What It Is

Community Land Trust: The Future of Affordable Housing for First-Time Buyers?

You buy the home and lease the land.

The post Community Land Trust: The Future of Affordable Housing for First-Time Buyers? appeared first on RE: Find.


from Community Land Trust: The Future of Affordable Housing for First-Time Buyers?http://bit.ly/2YXOtF6

Most neighborly neighborhoods: Auburndale learns sign language for 2-year-old

Selling a Home Costs $20,851, Most of It Taxes and Commissions

The average homeowner spends $20,851 to sell their home, Zillow and Thumbtack found in an analysis of how much it costs to sell a home. More than two thirds of those costs are transfer or sales taxes and agent commissions, which total $14,281 for the median-valued U.S. home.

With more than half of sellers doing so for the first time, those common but often overlooked expenses might come as a surprise.

In San Jose, Calif., the cost of selling the typical home is an astonishing $83,770, in part because of its sky-high median home value of $1.2 million, which brings closing costs (taxes plus commissions) to $76,015. Professional help with home preparation and local moving costs are substantial as well in Silicon Valley, summing to an average of $7,755-behind only Sacramento, where prep costs come to $7,840 but closing costs are a more moderate $24,990.

The lowest sellers' costs are in St. Louis, where they average $13,704. It ranks third lowest for closing costs, which total $10,014-behind just Cleveland ($9,046) and Indianapolis ($9,858).

Nationally, the average total for professional home preparation and local moving costs is $6,570, comprising:

  • Exterior painting ($2,600)
  • Home staging ($1,805)
  • Interior painting ($1,245)
  • Local moving ($475)
  • Full-service lawn care ($145)
  • Carpet cleaning ($140)
  • House cleaning ($160)

Most sellers (79%) complete at least one home improvement project before putting their home on the market, and those who do are more likely to sell their houses for more than their asking price than those who don't – 22% versus 16%, according to the Zillow Group Consumer Housing Trends Report.

Methodology

This analysis includes closing costs of real estate transfer taxes plus 6% in agent commissions. It does not include other closing costs such as title insurance fees, filing fees and the cost of points bought from mortgage providers. Zillow applied transfer taxes and 6% in agent commissions to the median home value for each area. In cases where metro areas cross one or more state lines, Zillow computed transfer taxes by using the tax rate for the primary state for that area. For home prep costs, Thumbtack looked at tens of thousands of quotes from small business professionals around the country and determined the average cost for each expense within the selected metros. For the purposes of this analysis, exterior and interior painting, home staging, local moving costs, full-service lawn care, carpet and house cleaning were identified as seven of the most popular seller prep projects completed by Thumbtack during the home sale process.

The post Selling a Home Costs $20,851, Most of It Taxes and Commissions appeared first on Zillow Research.


via Selling a Home Costs $20,851, Most of It Taxes and Commissions

7 Adorable Tiny Homes That Prove You Can Live Large With Less

Monday, April 8, 2019

Can the Home Seller Call Quits on Your Real Estate Purchase?

Sometimes things can go south fast.

The post Can the Home Seller Call Quits on Your Real Estate Purchase? appeared first on RE: Find.


from Can the Home Seller Call Quits on Your Real Estate Purchase?http://bit.ly/2Ih6eJI

9 Homes With Dreamy Spots for April Showers

The Ultimate Home Field Advantage

Dining-Room Decor Fails So Bad They’ll Give You Indigestion

Ritzy Rentals: America’s 10 Priciest Neighborhoods for Apartment Dwellers

Friday, April 5, 2019

The No-Fuss Renovation: Changing Living Spaces Without Creating a Mess

An Offer You Can’t Refuse: NYC ‘Godfather’ Home Is Week’s Most Popular Listing

Thursday, April 4, 2019

Maximizing Space in a Small Kitchen

Many homes come with kitchens that are less than ideal. The lighting can be terrible, the appliances old, the floors grimy … and counter space? Well, that’s a nice idea.

Get the most out of the kitchen space you do have with these tips.

Make room

You can create extra space, even when it seems impossible. Over-the-sink covers, cutting boards and colanders help increase your workspace.

Burner covers for your stove and a large cutting board or tray can create extra counter space when you’re entertaining and want to set out snacks (provided you don’t need to use your stove).

Fold-up tables (attached to the wall or stand-alone) offer extra space when needed. If there's room, a butcher block or island instantly create food prep or storage space.

Another simple way to create space? Pare down your belongings - especially on the counters - and only keep the necessities.

Go vertical

A wall above the stove may be perfectly suited for a pegboard where you can hang pots, pans and utensils. Magnetic knife and spice racks can fit into small wall spaces under cabinets or above sinks.

Refrigerators can serve as storage space for magnetic spice racks, towels, pot holders, or dry-erase boards or chalkboards, which are both useful and decorative. And over-the-cabinet hooks and towel racks add extra storage quickly and easily.

Use bookcases

Small bookcases are a kitchen's best friend. They are perfectly narrow, they come in many heights and they offer tons of storage options.

In addition to keeping cookbooks tidy, they can also hold pots, pans, dishes, food items, storage containers and baskets.

Add hooks to the side of your bookshelf to store aprons or other lightweight tools.

Add art and color

Art and color are fast ways to personalize a small kitchen. Color-coordinated kitchen accessories become art in and of themselves, and a simple color palette lets the eye rest in a small space.

When using every inch of space, don't forget to leave room for a few decorative elements. Hang attractive tea towels with pushpins for a practical splash of color. And fresh flowers on a shelf or table instantly brighten the space and add life.

If you have a windowsill, an herb garden is the perfect way to use the space and bring vibrancy. You might even consider installing a vertical garden.

Cover eyesores

Every older kitchen has at least one eyesore: an ancient microwave, a scratched-up refrigerator or a hideous vinyl floor. If you’re not ready to put down the cash for a remodel, cover these as best you can.

Cover exposed sink pipes with curtains attached to the bottom of the sink (bonus: extra storage space). Store your old microwave or replace it with a newer, more attractive version.

As for scratched or just plain ugly refrigerators and appliances, adhesive vinyl can create a like-new look in a matter of minutes.

Cover unsightly floors with kitchen-friendly mats that also make standing at the counter easier on your feet, and refresh old cupboards and drawers with plain or patterned drawer liners.

Upgrade lighting

Lighting in any kitchen is hard to get right. Many fixtures make the space feel dated, and upgrading bulbs and cleaning light covers will make a difference right away. Consider installing adhesive under-cabinet lighting to better illuminate your workspace.

If you can direct your lighting, such as track lighting, make sure it points to the kitchen triangle - that well-worn path from the stove to the sink to the refrigerator.

If overhead lighting is scarce, consider using table lamps and even floor lamps. A floor lamp in a kitchen might seem odd at first, but put it at the end of a counter or tucked behind a table, and you'll be grateful for the extra light.

Related:


Originally published June 6, 2016. 


via Maximizing Space in a Small Kitchen

Roommate Relations: Making Smart Use of Shared Spaces

Renting a home with other people can be stressful. But with careful planning and clear communication, living with others doesn't have to lead to passive-aggressive notes and arguments.

Whether you live with your sibling, your bestie or your significant other, try these tips for making smart use of those shared spaces.

Closets

What matters most when sharing closet space is equality. No, you don't need to make a line with tape on your closet floor (please don't). But you should stick to your designated areas.

Hang vertical cloth shelves in the middle to store your shared towels and extra sheets, while also creating a closet divider. And when you toss your shoes in the closet, make sure they're on your side.

Cabinets

Maximize the cabinet space you're given by adding stackable wire shelving racks. In the kitchen, they’re great for storing plates on top and bowls below. And under your sink, you can put extra sponges, cleaning rags and garbage bags below with your cleaning spray bottles up top.

Storage bins and plastic stackable boxes can also save the day - especially when it comes to bathroom storage. Put your skincare items in one and your dental products in another.

These stackable boxes come in all sizes - the ones with more depth can fit your bulkier products, and the shorter boxes are better for smaller items, like your travel-size products.

Pantry

Once you place those stackable wire shelves in your kitchen pantry, you'll soon learn that labels and plastic bins rule.

If you decide to share spices and other items like flour, vegetable oil and cooking spray, try arranging them in bins with labels that say "Shared." Use more labels to mark shelves and bins with each roommate’s name, if you think you'll all need the reminder.

Countertops

Decide with your roommates if it’s OK to keep items on the kitchen and bathroom counters. It may seem silly to discuss countertop space, but you'll be glad you did.

Decide how many and which items you agree to allow on the counters. Does the toaster that you never use drive your roomie crazy? Are you okay with your BFF's curling iron always being on the bathroom counter?

Air out your countertop pet peeves - you can always find ways to avoid potential disagreements.

The shower

Avoid any possible product mix-ups with a couple of shower caddies. Hang one over the shower head, and put another one (or two) with suction cups on the shower wall. Plus, storing your bath products in hanging caddies leaves the corners of your tub easy to clean.

Storage

If your place comes with its own storage space, try using a tall shelving unit and dividing the shelves equally among you.

If someone ends up slowly taking over the unit, try putting your belongings in labeled plastic bins. If things really get out of hand, see if your storage buddy may be willing to pay a bit more in rent or utilities.

Parking

Your apartment comes with a covered parking spot? Sweet! Oh, it only comes with one parking space? Not so sweet.

Try rotating its use every week or month. Or make an arrangement saying that whoever uses the parking spot can pay more in rent each month. Another idea: The roommate with the covered parking spot could do more chores than the other roommates.

The key is deciding as a team in advance what's fair - and sticking to it.

Pets

If one of you has a pet, how do you decide where the crate, toy basket, and food and water bowls go? It may make sense to put pet items in common areas, but the pet owner shouldn't assume all roommates are cool with squeaky toys all over the living room floor - no matter how cute that pup is.

Just like you'd pick up your things from the living room, you'll want to pick up Fido's stuff, too.

Wall space

Don't hang your art in common areas without getting your roommates' opinions first. Turn decorating your walls into a roommate activity. Gather all the art and decorative wall items you want to hang, and have everyone choose their favorites.

You can even turn it into a chance to get to know your roommates better. Have a cool story about where you got that tapestry? Got your favorite mural while studying abroad? Tell your roomies all about it - and listen to their stories, too. They may be willing to put up all of your wall decor once they know the meaning it holds.

If all else fails, stick with similar color palettes, and decorate based on shared color groupings. Remember that what doesn't go up in the living room can go up in your room.

Space-saving lifesavers

You can use all the fancy organization materials you want, but sometimes the basics are best.

  • Adhesive hooks are great for hanging towels when you need extra bathroom space - or for hanging keys in the entryway.
  • Use shoeboxes to store smaller items like scarves, winter gloves and cosmetics. Label them to make everything easy to find, and you can even decorate them with wrapping paper to pretty them up.
  • Toilet paper rolls are an organizational lifesaver when you have too many cords. Designate each type of cord within one roll, and label them so you never mix up your roommates' cords with yours again.
  • Over-the-door hangers are essential for items like purses and coats. Or try an over-the-door shoe hanger on one side of the door, with your things hung on the other side for double the saved space.
  • Under-the-bed storage containers are key for off-season clothing items or bulky boots that don't seem to fit anywhere else. Your roommate will thank you for the extra closet space.
  • Fabric panels are an inexpensive way to divide a room for added privacy.

Even if the people you live with are not quite as organized as you, rest assured that at least your belongings are contained on their shelves and in their assigned containers. Having smart shared spaces allows you to enjoy your time with your roommates without stressing over whose stuff is whose.

Looking for more information about renting? Check out our Renters Guide

Related:


Originally published September 9, 2016.


via Roommate Relations: Making Smart Use of Shared Spaces

Want to Own a Little Frank Lloyd Wright? Here’s How for Just $25

$35.5M Euro-Style Spec Mansion Is the Week’s Most Expensive New Listing

Affordable commuter neighborhoods locals love

Quiz: Which Listing Features Could Help Your House Sell for More?

Wednesday, April 3, 2019

5 Tips for Spring Lawn Prep

Even if your lawn is made up of weeds more than actual grass, you can turn it around with some basic spring maintenance. Try these five tips to get your lawn ready before the weather warms up and the grass (and weeds) leave you in the dust.

Prevent weeds

Proper mowing, irrigation and feeding practices are the best possible weed prevention, but established weed populations require drastic measures.

Use a preemergent herbicide to stop warm-season weeds before they sprout. And even a weed-free lawn can easily be undone by nearby weeds and their traveling seeds, so remove any weeds in the garden now so they don't find their way into your lawn.

If your lawn has bare spots, fill them in now with sod or seed so weeds don't sprout and get a foothold.

Start your engines

Much like cars, lawnmowers will stop working without routine maintenance. If you haven't already done so in the fall, replace the mower's oil and gas with the types recommended in your mower's instruction manual.

This would also be a good time to replace that corroded spark plug and dirty air filter. Add a fuel stabilizer to keep the gas from going stale and harming the mower's engine.

A dull mower blade makes your grass more susceptible to disease with each ragged cut it makes, so sharpen the blade with a metal file when it starts to get dull. Clean your mower often to improve performance and prevent corrosion. If you own a riding mower, air up the tires for an even cut and comfortable ride.

Clear out thatch

You know that spongy layer of dead grass that builds up in your lawn? That's thatch. A thin layer of thatch is normal and even healthy, because it protects the soil, roots and beneficial organisms. But when that thatch gets about an inch tall, drought, weeds and other problems develop.

Thatch is most likely to build up in lawns that have acidic or compacted soil - or lawns that have been excessively treated with herbicides and pesticides. If thatch is common on your block, prevent it with core aeration. This allows air to reach the soil, promoting organisms that naturally break down thatch. Use a vertical mower or power rake if the thatch is an inch thick or more.

Reseed and resod

None of these tips will do much good without a proper lawn. If your lawn feels beyond hope, consider starting from scratch.

If your existing lawn is an annual one, remove it with a sod cutter. Perennial grasses, like Bermuda or St. Augustine grass, are much tougher to remove, so you'll likely have to either solarize with clear plastic sheets for several weeks or resort to an herbicide.

Once you’ve dug up the grass or otherwise eradicated it, replace it with soil and a grass variety appropriate to your region. Plan on setting aside a day or two for installation.

Amend the bare soil with topsoil or composted manure, and lay down the sod or planting seeds by following the label instructions. After planting, water it often until the new grass becomes established.

Start good habits

If you're not already following a fertilizing schedule, start one now by following the directions on your product of choice. You will likely forget this schedule after the first feeding, so pencil in the dates on your calendar so you don't get off track.

Start the season off right by mowing more often, on a higher setting and in alternating directions. Inspect your sprinklers and pipes for possible breakage - a patch of damp soil or an excessive water bill would be your first clue. If your lawn seems to let into the surrounding landscaping, start edging now to define your boundaries.

A string trimmer is fine for maintenance, but cutting through the dirt with it could get messy. Either rent an edger or purchase a handheld half-moon tool to make deep, clean cuts that persist through the year for easier mowing and trimming.

Related:

Originally published April 2017.


via 5 Tips for Spring Lawn Prep

With Mortgage Rates at a Low, Loan and Refinance Applications Surge

The Term ‘Death Cleaning’ Got Added to the Dictionary Today—and It’s About Time

Tuesday, April 2, 2019

These Low-Income Communities Should Prepare for an Influx of Cash

Opportunity Zones-created by the Tax Cuts and Jobs Act of 2017 (TCJA)-are designed to bring capital to low-income communities, many of which have been starved of capital investment for many years. The zones-a collection of low-income or high-poverty census tracts scattered across all 50 states and Washington, D.C.-offer potentially large tax savings for investors who fund projects in these communities. However, some of the incentives within the policy may direct investment toward areas that already have demonstrated growth potential and return on investment.

One criticism of Opportunity Zones is that some of the selected areas don't need tax incentives to inspire investments that would have occurred anyway. Because the eligibility requirements for Opportunity Zones relied on sometimes lagged data and incomplete measures of economic distress, those familiar with the neighborhoods may be surprised to learn that certain tracts were eligible-and selected-as Opportunity Zones. Proponents of the policy argue selected communities  like the Pearl District in Portland, Ore., or Long Island City in New York are limited exceptions and shouldn't be used to judge the entire program. Instead, supporters contend that the vast majority of Opportunity Zones are well-targeted designations that can usher in sorely needed capital to fuel revitalization and economic growth for communities that have been left behind by recent prosperity.

Even if only a small number of zones are "exceptions," there are no rules that investment must be spread evenly, and some speculate that a lion's share of the capital will find its way into these exceptions.

Developers are likely already well aware of which areas best suit their investment plans and where Opportunity Zone funds might ultimately cluster. (Sale prices surged last year in neighborhoods now eligible for these tax breaks.) However, because it's a federal tax break that may not require advance paperwork with the city or county, some local officials may be less aware of what's coming. At the same time, these local leaders have additional policy options they can layer atop Opportunity Zone investments to achieve their desirable policy outcomes from developments–such as maintaining affordable housing, creating jobs for residents, supporting green building, and so on. By using market indicators to find neighborhoods that might be on the edge of an influx of capital, local policy makers can think strategically about deploying additional local policy tools to achieve their goals.

Areas likely to receive investments

Below are the top 51 Opportunity Zones where recent market dynamics indicate a relatively strong likelihood of investment. Despite all of these areas qualifying for the tax break (albeit based upon somewhat lagged data) and being selected by the Governor of each state from a much larger pool of eligible tracts, many of these neighborhoods have experienced robust housing markets or significant economic transformations.

Where possible, we assigned neighborhood names to census tracts in order to discuss these zones in terms that people are more familiar with. (Note that the text in bold are areas not in Zillow’s neighborhood database and required a best guess by eyeballing tract boundaries).

Census Tract City Neighborhood County State Rank
36047000100 New York Brooklyn Heights Kings County New York 1
26163518000 Detroit Wayne State Wayne County Michigan 2
22071004000 New Orleans Treme’ Lafitte Orleans Parish Louisiana 3
47037016200 Nashville Historic Waverly Place Davidson County Tennessee 4
36047080400 New York Prospect Lefferts Gardens Kings County New York 5
36047009800 New York Sunset Park Kings County New York 6
36047024300 New York Bedford Stuyvesant Kings County New York 7
25025040300 Boston Charlestown Suffolk County Massachusetts 8
36081007900 New York Astoria Queens County New York 9
47037016300 Nashville Edgehill Community Garden Davidson County Tennessee 10
39061001000 Cincinnati Over-The-Rhine Hamilton County Ohio 11
24033801600 Prince Georges County Glassmanor Prince Georges County Maryland 12
12086010016 Miami Gardens Miami-Dade County Florida 13
42101008602 Philadelphia Walnut Hill Philadelphia County Pennsylvania 14
36047026500 New York Bedford Stuyvesant Kings County New York 15
42101008302 Philadelphia Cobbs Creek Philadelphia County Pennsylvania 16
36081003300 New York Astoria Queens County New York 17
36059416500 Long Beach Nassau County New York 18
36047037300 New York Ocean Hill Kings County New York 19
18097354200 Indianapolis Downtown Marion County Indiana 20
44007002500 Providence Smith Hill Providence County Rhode Island 21
36047041500 New York Bushwick Kings County New York 22
25025061000 Boston South Boston Suffolk County Massachusetts 23
42101002000 Philadelphia Point Breeze Philadelphia County Pennsylvania 24
48201310600 Houston Greater Eastwood Harris County Texas 25
06001423500 Berkeley South Berkeley Alameda County California 26
26163513700 Detroit Jefferson Chalmers Wayne County Michigan 27
36005025100 New York University Heights Bronx County New York 28
06067000500 Sacramento Boulevard Park, Mansion Flats Sacramento County California 29
08059011550 Lakewood Two Creeks Jefferson County Colorado 30
18097356200 Indianapolis Downtown Marion County Indiana 31
42101037800 Philadelphia Fishtown Philadelphia County Pennsylvania 32
36047039700 New York Bushwick Kings County New York 33
22071013400 New Orleans Central Business District Orleans Parish Louisiana 34
22071002700 New Orleans Seventh Ward Orleans Parish Louisiana 35
42101016100 Philadelphia East Kensington Philadelphia County Pennsylvania 36
06081612100 Menlo Park The Willows San Mateo County California 37
42101008500 Philadelphia Cobbs Creek Philadelphia County Pennsylvania 38
48201421600 Houston Gulfton Harris County Texas 39
25025160200 Chelsea Suffolk County Massachusetts 40
36047010400 New York Sunset Park Kings County New York 41
25017339700 Medford South Medford Middlesex County Massachusetts 42
42101013700 Philadelphia Brewerytown Philadelphia County Pennsylvania 43
39049005300 Columbus Olde Town East Franklin County Ohio 44
12081000306 Bradenton Manatee County Florida 45
36047051300 New York Williamsburg Kings County New York 46
39049003800 Columbus Olde Town East Franklin County Ohio 47
45019000700 Charleston Radcliffborough Charleston County South Carolina 48
36085020700 New York Port Richmond Richmond County New York 49
36047010100 New York Greenwood Kings County New York 50
41051005100 Portland Pearl District Multnomah County Oregon 51


Ranking these areas on a variety of housing market characteristics-including market trends in recent years and well as early changes to housing trends after the designation of Opportunity Zones-shines a bright light on Brooklyn. Many of the New York borough's neighborhoods have experienced large gains in the median value of homes in recent years and are among the tracts with the highest home values in their respective county. Miami, Nashville and Philadelphia are also home to several Opportunity Zones with relatively hot housing markets.

While several New York City metro neighborhoods earn a space in the top 10 ranking according to these measures, when considering the full range of Opportunity Zones, the region most disproportionately poised for Opportunity Zone investment is Boston.

Using this ranking scheme, the top 10 metros with the highest average ranks among their Opportunity Zones included in this analysis are (among places with at least 10 OZs ranked):

Metro Area Average Rank of Metro's Opportunity Zones
(out of 3,400+ Tracts)
Number of OZs
Boston, MA 605.4 51
Miami-Fort Lauderdale, FL 748.3 105
Worcester, MA 807.1 15
Springfield, MA 831.3 12
North Port-Sarasota-Bradenton, FL 832.4 11
Nashville, TN 859.5 24
Providence, RI 884.3 24
New Orleans, LA 979.6 14
San Francisco, CA 1010.0 55
Denver, CO 1026.5 31


The top 10 states using the same parameters:

State Average Rank of State’s
Opportunity Zones
Number of OZs
Massachusetts 700.7 81
Rhode Island 946.3 18
District of Columbia 971.7 19
Nevada 1108.5 41
Colorado 1114.9 49
Florida 1180.5 318
Washington 1238.1 70
Oregon 1337.4 38
New Hampshire 1402.2 13
Utah 1444.3 29

Methodology: What went into the index?

We created an index of seven factors to rank among Opportunity Zones where investment designed to maximize return on investment in residential real estate is likely to cluster. We created an index to best highlight these zones, because to some degree there is a zero-sum nature to these Opportunity Zones-capital invested in one location isn't being invested in another. So, while the individual growth rates and other characteristics for each tract matter, it's also important and actionable to understand how the tracts compare relatively to each other.

We included mix of a few early indicators (changes post-selection) and some characteristics of the tracts near the time of the selections. We constructed all the measures so that a higher value corresponds with a higher ranking.

Obviously different investors prioritize different market indicators, and likely have their own criteria for evaluating development sites to meet their specific needs. For example, this list will look significantly different if you put more weight on median home value percentage growth or decide to care less about and the change in transaction volume. Below are the factors and the relative weights we used to create this ranking.

Things we cared most about (weight 1) – The early indicators of investment:

  • The percentage point difference in the Zillow Home Value Index (ZHVI) growth in each tract during the period 7 months following selection of all zones (June-December 2018) compared to the 7 months before any zones were selected (September 2017-March 2018)
  • The increase in sales volume during the 6-month time period after all zones were selected (June-November 2018) compared to that same period (June-November 2017) the year prior.

Things we cared next most about (weight .75) – Characteristics of the tract's recent past:

  • ZHVI percent growth during the three years prior to any selection of opportunity zones.
  • The real dollar level increase in ZHVI during the three years prior to being selected an opportunity zone.
  • Tract ZHVI relative to county ZHVI the month prior to any zone designation. Indicator that home prices in the zone are relatively sturdy today without any Opportunity Zone fund investment.

Other things we cared about (weight .5) – Other potential signals:

  • The share of the properties in the census tract that are not single-family homes. Proxy for zoning that allows multifamily development/investment potential.
  • The increase in the share of the purchases where the buyer was a Trust in the 6-month time period after being selected (May – October) relative to that same period the year prior.

We were limited to the about 7,100 of the 8,700 total Opportunity Zones that we produce a ZHVI for. We don't produce ZHVI in tracts with a very low number of residential prosperities.  We further limited the analysis to tracts in the top 200 largest metros and removed tracts with fewer than 250 residential properties in our database; tracts with fewer than 10 sales during the time frame we measured; tracts where we don't produce county-level ZHVI due to data issues; and tracts where the ZHVI is lower than $20,000.

After these quality filters, we are left with 3,474 Opportunity Zones.  It's also important to note that this is based on likely investments for residential real estate development. Due to our property count requirements, we are not really considering tracts comprised of mostly industrial zones, factories, hospitals, warehouses, farmland, or other areas with very few residential properties. We would certainly expect different types of Opportunity Zone investment to cluster in those types of areas, but we are unlikely to capture signals of that demand in residential property values.

The post These Low-Income Communities Should Prepare for an Influx of Cash appeared first on Zillow Research.


via These Low-Income Communities Should Prepare for an Influx of Cash