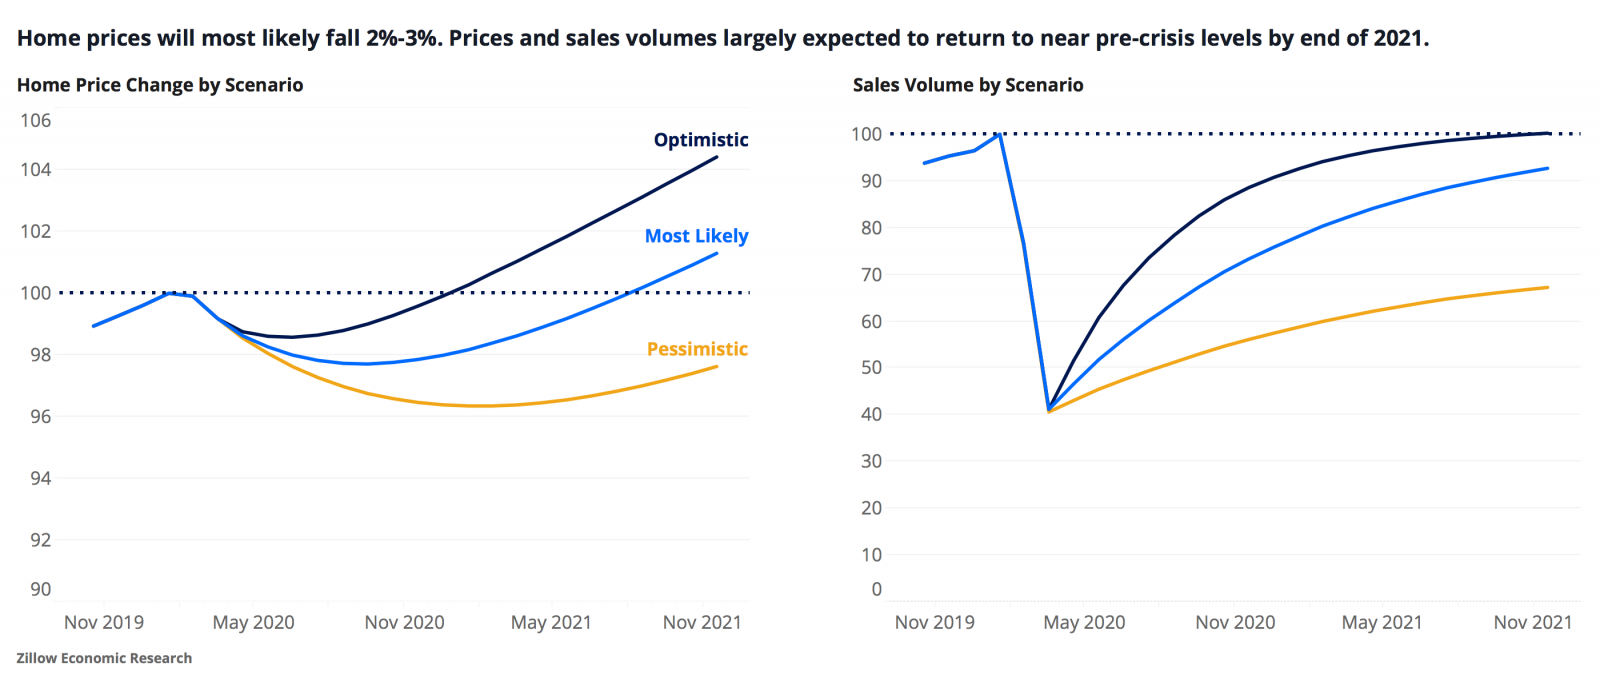
The continued economic fallout from the spread of COVID-19 has introduced immense uncertainty into the housing market as consumers step back from large purchases and social distancing puts a chill on necessary market services. As a result, Zillow expects home prices will most likely fall 2%-to-3% through the end of the year from pre-coronavirus levels, and home sales to fall as much as 60%, before both begin to slowly recover to baseline levels by the end of 2021.
The latest forecasts, based on published and proprietary macroeconomic and housing data, also include more pessimistic or optimistic projections based on the duration of the pandemic and the depth of its impact on the broader economy.
The forecasts center around a baseline prediction of a 4.9% decrease in United States GDP in 2020 and a subsequent 5.7% increase in 2021. Under the baseline scenario, we expect:
- A 2%-3% drop in prices through the end of 2020, followed by a slow recovery throughout 2021. Prices will return to Q4 2019 levels by Q3 2021.
- A 50% decline in home sales from their pre-coronavirus levels, as measured at the end of 2019. Home sales will bottom out in Q2 before beginning to improve near the end of Q2 2020.
- Sales volume will recover to about 97% of Q4 2019 levels by the end of 2021.
- The pace of recovery is what distinguishes our three scenarios from one another.
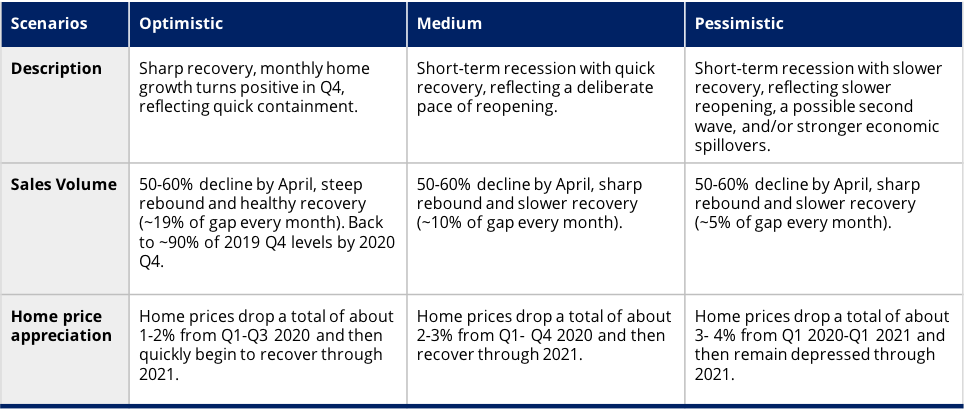
Each of our scenarios implies very different paths for home prices and sales volumes. Our optimistic scenario features a small dip in house prices in Q2-Q3 followed by a robust recovery. The baseline medium scenario features a U-shaped trough in Q4 followed by a slower recovery and our pessimistic scenario features continued weakness through all of 2021 (more of a "long U" shape). Under our more-optimistic assumptions, the market could experience a fast, V-shaped "snapback" similar to what happened in the Hong Kong real estate market after the 2003 SARS outbreak. The medium scenario features a "check-mark" shaped recovery and our pessimistic scenario features more of a "wide-U" recovery, with a longer bottom and more gradual pace of improvement.
Overview of Our Scenarios
At time of publication, we believe the medium scenario to be the most likely outcome, followed by the pessimistic scenario and then the optimistic scenario. These scenarios and our assessment of their likelihoods are open to revision and will be revisited periodically as more information regarding the timing, scale and success of relaxed social-distancing measures, among other factors, is released.
How Did We Get Here?
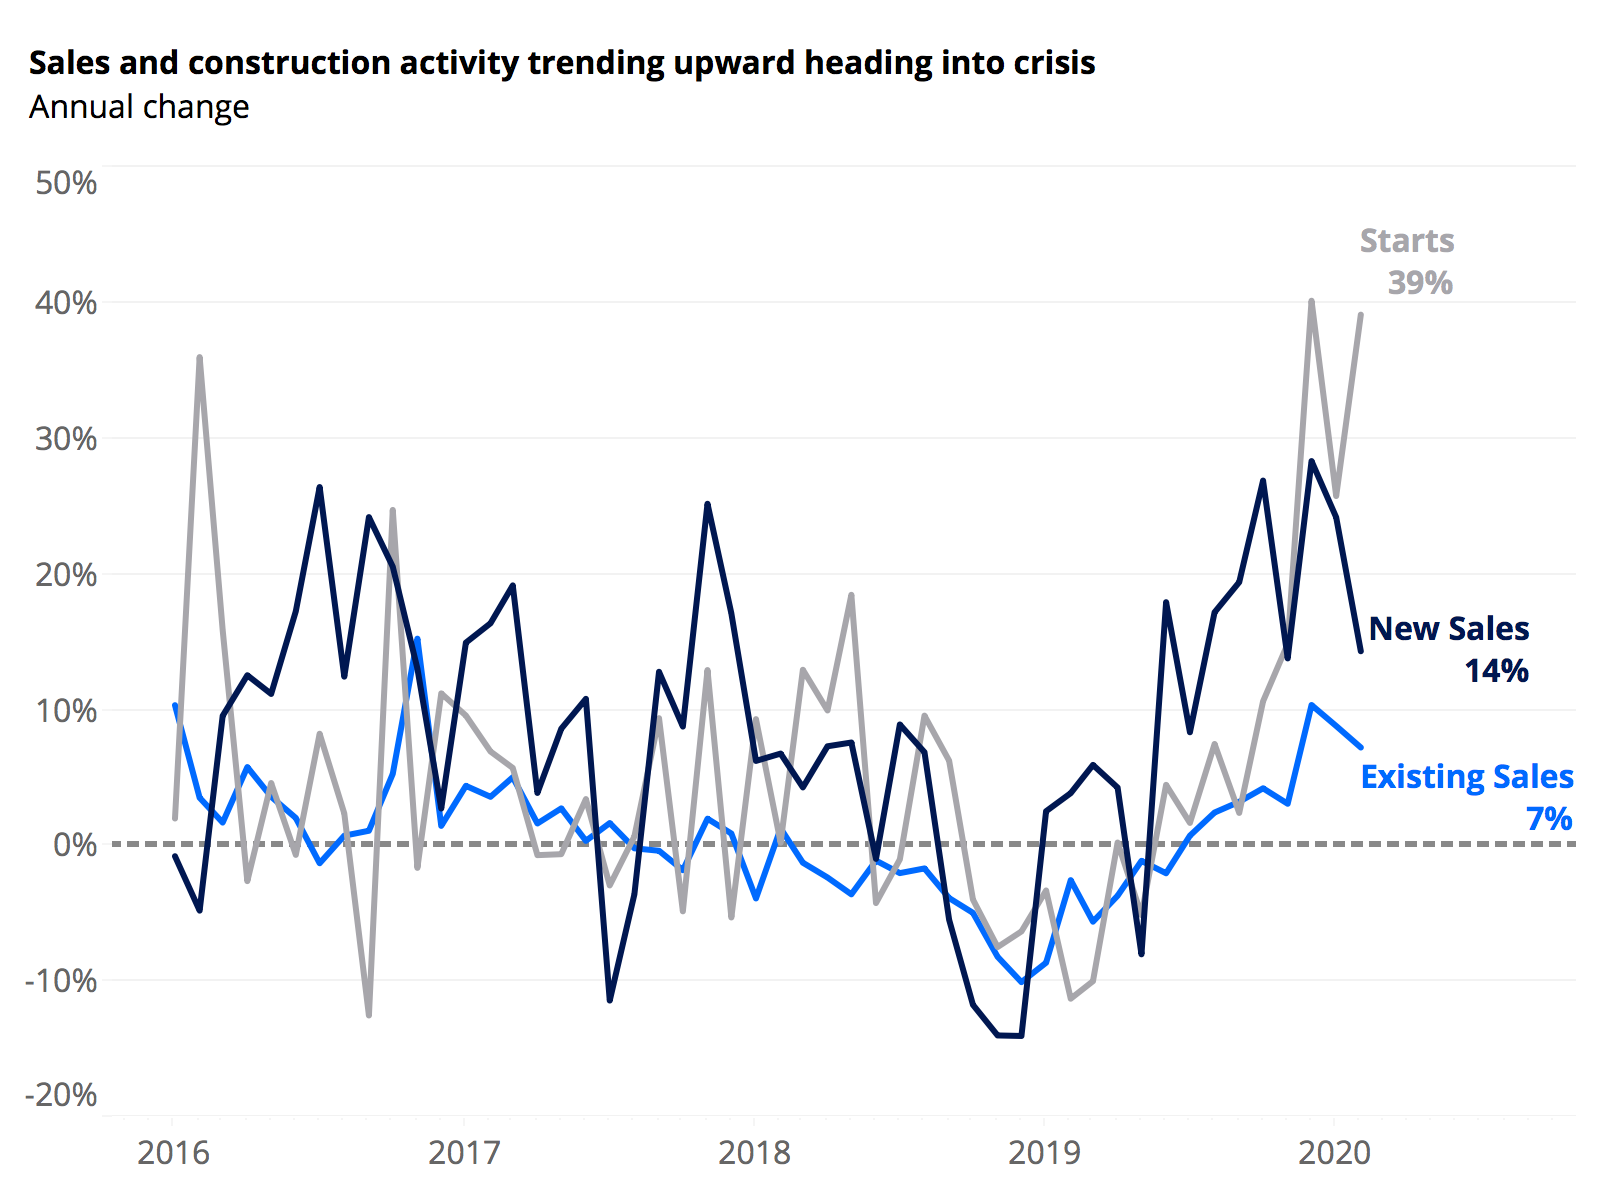
The housing market was beginning to heat up at the end of 2019 and into early 2020. Home price appreciation had begun to reaccelerate after a fairly tepid 2019. Sentiment across most market participants (buyers, sellers, lenders, homebuilders) were all at or near their survey highs. Sales volume and construction levels were both rising at an increased rate. Mortgage delinquency rates were near all-time lows, and record-low for-sale inventory was fueling competition for the few homes on the market.
In addition to a generally strong housing market, the broader U.S. economy was also showing signs of strength, despite some looming concerns. The labor market was riding high: The overall unemployment rate was 3.5%, tied for its lowest level in 50 years; an average of 224,000 jobs were created in the three months ending February 2020; and labor force participation was near a seven-year high. The manufacturing sector, which struggled through much of 2019, was beginning to recover as global tensions (trade war, Brexit etc.) eased and simplified. And consumer spending levels remained steady through February.
Of course, not everything was perfect. Corporate debt levels have risen markedly in recent years, and the quality of debt was beginning to be questioned even before the pandemic. Non-financial corporate debt securities and loans increased to almost 47% of GDP in the last quarter of 2019, up from a post-recession low of 40% in Q4 2010. As of January, only two U.S. companies (Microsoft and Johnson & Johnson) had AAA debt ratings — indicating the highest level of credit-worthiness. Businesses were also scaling back on investments in capital, suggesting they viewed their longer-term prospects as tenuous. Manufacturers’ spending on nondefense capital goods was lower in February 2020 ($68.8B) than it was in February 2012 ($69.7B), despite eight years of economic expansion. And ten years into a record-long economic expansion, the key Federal funds rate as set by the Federal Reserve was very low, leaving the Fed with less wiggle room than usual to stimulate the economy in the case of a downturn.
Even before the onset of the crisis, these factors combined to somewhat dampen our forward-looking outlook. But in general, macroeconomic conditions were sturdy heading into the spring. And this relatively strong economy, coupled with strong demand from home buyers and relatively friendly buying conditions thanks to low mortgage interest rates, meant the housing market was well-positioned for a strong spring selling season.
But over the course of just a few weeks, that all got turned on its head. More than 30 million (and counting) unemployment insurance claims have been filed since the middle of March, representing about one-in-six of all previously employed people counted in the March jobs report. Retail sales levels plummeted in March, falling 8.7% from February, the biggest one-month decline since the Commerce Department began tracking the data in 1992. Industrial production fell 5.4% over the same period, the largest one-month decline since the 1940s.
These and other disruptions have been shocking in both their speed and scale. But even so, we believe many of them to be transitory and will be addressed as the economy opens up again.
Scenario Specifics
In creating this forecast, we relied heavily on macroeconomic forecasts created by Goldman Sachs and the International Monetary Fund, both of which call for a 5%-to-6% decline in GDP in 2020, followed by a 4.5%-to-5.5%% increase in GDP in 2021. A number of high-frequency data points published by Goldman Sachs offering insight into many industries and sectors, including housing, also allowed our team to make frequent updates to our outlook based on hard, industry-specific data.
Our forecast follows a similar structure to Goldman's, which estimates how much of the gap between actual and potential GDP disappears in the following month for different industries. Our baseline forecast for GDP assumes the same persistence in the gap between actual and potential GDP as Goldman Sachs does. To translate the GDP forecast into a forecast of home prices and transactions, we conducted two separate econometric analyses — relating both long-term home price growth and home sales to GDP — and applied the findings to our GDP scenarios. For home price movements over time we used data from the S&P CoreLogic Case-Shiller home price indices. For sales volume over time we used data from the National Association of Realtors. More information on the specifics of our econometric analysis can be found in the appendix below. We also overlaid scenario-specific factors based on the spread of COVID, the strength of social distancing measures and early signals of recovery in order to come to our conclusions. Specifically, our baseline predicts that about 10% of the gap between actual home transactions and baseline trend disappears in the following month. Differences in the persistence of this gap are what differentiates the three scenarios from one another. The optimistic scenarios for home prices and transactions suggest this gap will recede about twice as quickly as it would in the medium scenarios. The pessimistic scenarios, meanwhile, suggest the recovery rate will be half that of the medium scenarios.
To track the probabilities of these scenarios and to alert us to the need for potential changes (especially to the shape or speed of recovery paths), we are focusing mainly on forward-looking indicators, outside forecasts and empirical studies. On the forward-looking indicator side, we are most-closely tracking survey data and selected financial statistics. The survey data are currently telling us that we should expect much more short-term disruption than longer-term. For instance, the Philadelphia Fed Manufacturing Business Outlook Survey from April 2020 indicated that while most manufacturers view current conditions negatively (worse than 2008-09), they are much more optimistic about future conditions (unlike 2008-09). Similarly, the University of Michigan Surveys of Consumers for April 2020 show a large fall in consumer sentiment reflecting current conditions, while the fall in consumer expectations has been less extreme. Meanwhile, financial data (especially measures of implied volatility such as the VIX, policy uncertainty, mortgage rates and bond spreads) are indicating that financial risks during late March briefly approached the conditions of late 2008, but have since subsided somewhat. That said, we will closely monitor financial data to see if we need to revisit the possibility of creating an even more pessimistic scenario that includes a more fully fledged financial crisis.
Housing-specific data have also validated our assumption of a ~50% decline in sales, while also beginning to offer some clues as to what the next phase of this crisis is going to look like. For-purchase mortgage applications have fallen 31% from a year ago, but have recently shown some signs of stabilization. At their worst, home showings fell as much as 50% since the beginning of the year, but subsequently rose to a level "only" 27.5% below where they were to start the year. Internal measures of newly-pending home sales and new for-sale listings have also shown signs of turning the corner.
Downside Risks and Go-Forward Plan
While our internal and external data currently point to a bottom in real estate transactions at the beginning of April 2020, we are watching for signs of either a renewed contraction or other indicators of a slowing recovery. We are also monitoring the results of ongoing epidemiological studies showing the efficacy of efforts to help curb the spread of the coronavirus and early economic reopening efforts, to help inform us on the likely speed and shape of a recovery. We are also monitoring and commenting on macrofinancial data including corporate bond spreads, mortgage rates, implied volatility and delinquency rates for signs of unexpected weakening. Widespread deterioration in these and other key data risks the economy landing closer to a 2008-style financial crisis scenario, on top of the direct effects of the pandemic.
On top of the broader economic dangers, there are also a number of public health and/or policy risks that, if worsened, might warrant an adjustment of our probability weights and possibly the creation of a more pessimistic scenario to consider. These include:
- A relative lack of coordination between states in their plans to reopen their respective markets, risking the introduction of state-to-state disease transmission, false restarts, risks of new outbreaks and a deeper/longer downturn.
- A continued shortage of testing and personal protective equipment (PPE), limiting the ability to track and contain the virus's spread and placing continued stress on the health care system.
- Ineffective or insufficient federal fiscal relief efforts, resulting in a larger-than-expected impact to labor and financial markets and threatening state balance sheets.
- As-yet-unquantified risks to the balance sheets of households (people's ability to pay their debt obligations, willingness to resume normal spending activity) and businesses (how many businesses close and/or resume activity with lower employment?).
- Ineffective relief in the mortgage industry.
Appendix
For our medium scenario, we assume that GDP follows the monthly path laid out in Goldman Sachs' March 30 forecast, which calls for 1.75% annual growth in trend real GDP. Additionally, based on internal data, we assume a sharp 50% direct hit in April to COVID-sensitive service sectors, including real estate transactions, with March as a transition month. This direct hit to transactions has a 90% persistence rate per month, such that May's direct hit is 45% of real estate transactions, and so on. Goldman Sachs also models the effects of fiscal and monetary policy as well as the second-round effects of the loss in income, to arrive at a monthly output gap (i.e. the difference between actual GDP and trend). These output gaps and trends give us monthly GDP forecasts that serve as the basis for our other forecasts. Where Goldman Sachs' measured effects of COVID deviate from their overall quarterly forecasts (mainly for Q1 and Q2 2020 data), we stick with the monthly forecasts. We report our GDP forecasts in Table 2, where "GS (15 Apr)" refers to the most recent forecast from Goldman Sachs, and "IMF WEO" refers to the most recent forecast from the IMF in their World Economic Outlook.
Table 1: Real GDP paths and growth rates by scenario
Table 2: The paths of home prices under our various scenarios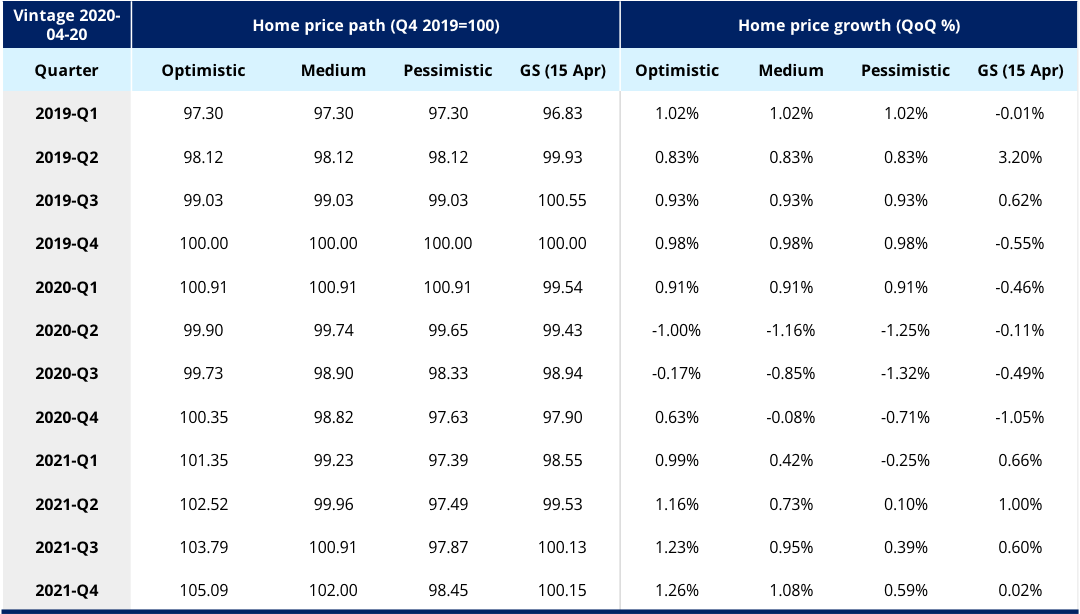
Table 3: The paths of transaction/sales volumes under our various scenarios
The post Zillow Forecasts a Dip in Home Prices, Rebounding By Next Year appeared first on Zillow Research.
via Zillow Forecasts a Dip in Home Prices, Rebounding By Next Year

No comments:
Post a Comment