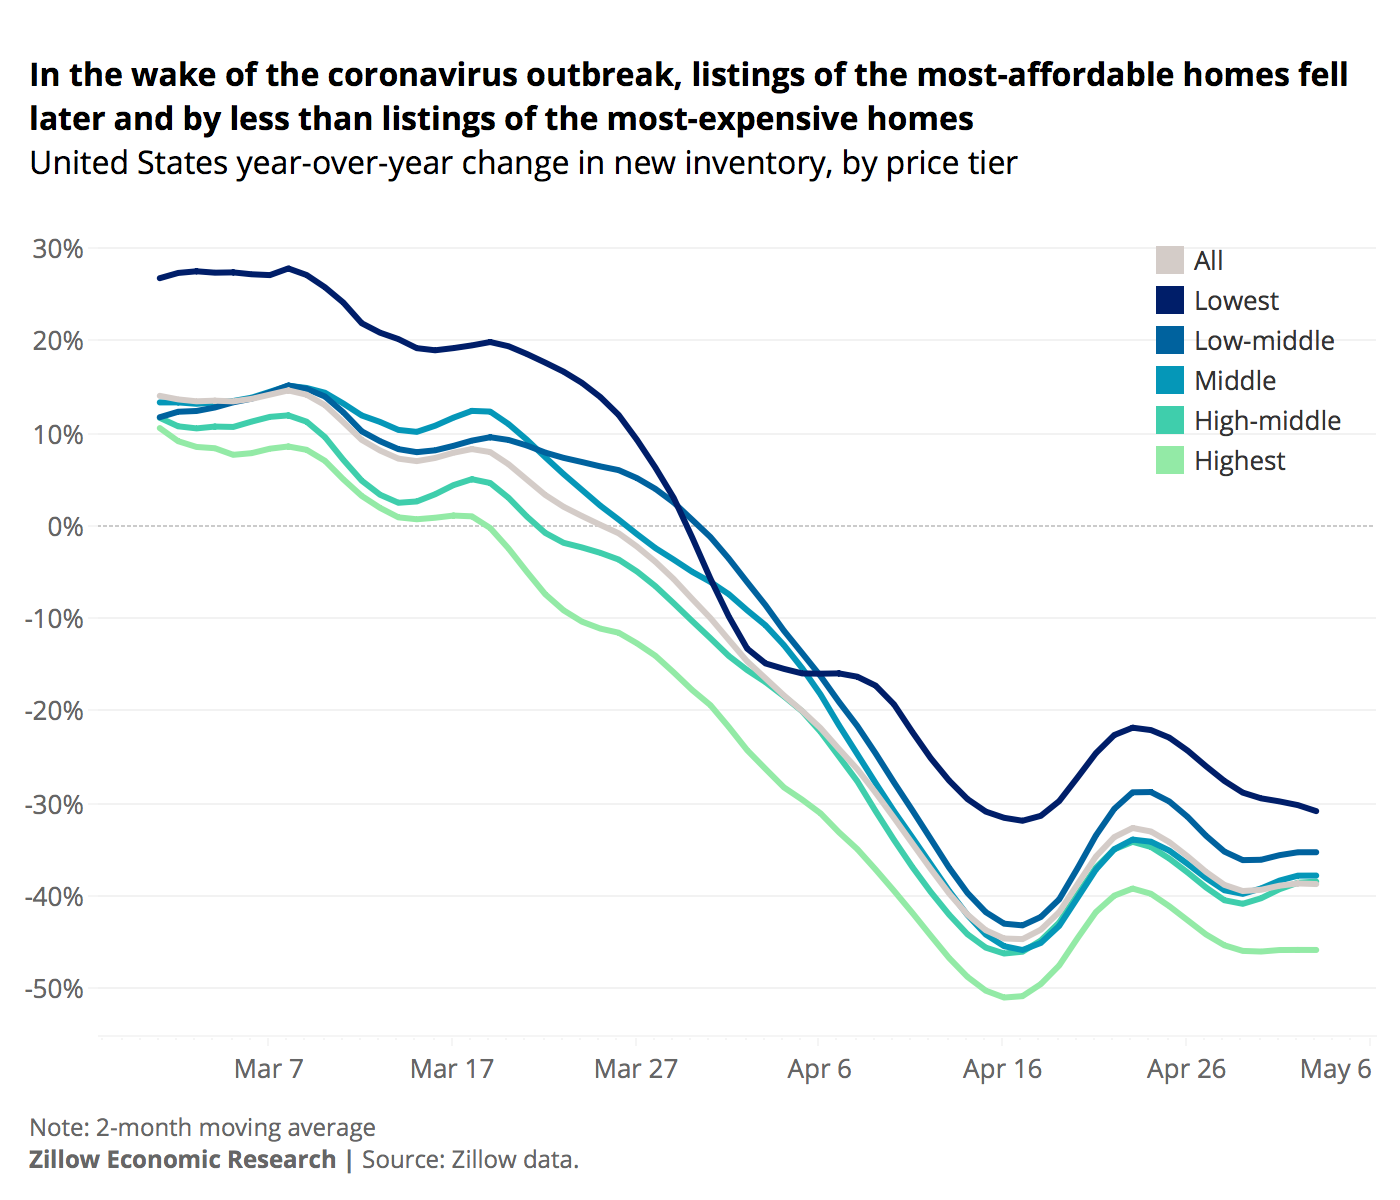
- New listings are down 39% year-over-year overall. But new listings of the most-expensive homes are down 46%, while the least-expensive homes are down only 32%.
- Because of this composition change, growth in the median list price has lagged behind home value growth of recent months.
- Listings of the most-expensive homes began to fall below 2019 levels on March 18, while the most-affordable listings did not fall into negative year-over-year territory until more than a week later.
The overall number of newly listed homes for sale on Zillow was down 39% year-over-year as of May 3, a slightly larger decline than the week before and a reminder that the usual surge of Spring listings is not happening this year in the wake of the nationwide coronavirus outbreak.
But while the pullback in listing activity has been deep and widespread, some sellers are still making the choice to list their homes — people choose to buy and sell homes based on major life events, which are still very much happening, and not just market activity. And sellers of the nation's most-affordable homes appear to be more willing to test the waters than owners of more-expensive homes.
Nationwide, new listings among the priciest fifth of homes were down by 46% compared to a year ago, according to a Zillow analysis of listing counts by home value quintile, up a little from the 51% year-over-year decline recorded in mid-April, but still by far the most depressed segment. New listings of these most-expensive homes were the first to fall in response to the pandemic, and receded most quickly from the market when the U.S. outbreak began in earnest in March. These listings began to fall below 2019 levels on March 18, while much cheaper listings did not fall into negative year-over-year territory until more than a week later. On a typical early-May day in past years, about 28% of new for-sale listings were priced within the top fifth of the home value distribution in a given metro. As of the week ending May 3, these homes made up 25% of new homes coming onto the market.
But listings of the most-affordable homes — those among the bottom 20% of area home values — while still down considerably, fell by just 32% year-over-year. These homes currently account for slightly more than 17% of all new listings — up from 15% at this time in a more-typical year.
Determining the kind of homes being listed this season can offer some early clues as to the resilience of the market and any potential future impacts on home prices as the enduring impacts of the coronavirus crisis unfold. The early differences emerging show that sellers are balancing their decision to sell differently at different price points. There could be a few effects contributing to the imbalance. First, sellers of higher-priced homes might have more flexibility in their selling decision. They could be more likely to be in a position to delay their move, perhaps anticipating that they can fetch a better price when more buyers can come to market. It could also be that more expensive homes require more professional preparation before listing, and those businesses may be shuttered in the current environment (though listings in this tier started falling well in advance of stay-at-home orders).
Local Echoes
The national trend — more-affordable homes showing smaller declines in listings — largely holds in most large, local markets. The number of new listings within the top tier of home values plunged further than new listings in the market as a wholehas fallen the most in 37 of the largest 50 metropolitan areas. The bottom tier has fallen more in only 8 of these large metros.
Some markets buck this trend, like Indianapolis and Las Vegas which practically reverse it. However, most markets share a similar trend to the nation as a whole, with new listings at the bottom quintile contracting 15%-40%, the middle quintile 25%-50%, and the top quintile 30%-55% in most metros. The extremes are the Detroit, Pittsburgh and New York metros, where new listings were down by more than 50% in each tier and more than 60% in many.
Price Changes, or Composition Changes?
When considering the changes in composition among the prices of listed homes, we must consider how these inventory changes impact price trends. The share of inventory made up by the top two tiers has fallen by two percentage points from last year. With the most-expensive listings making up a smaller-than-usual share of listed homes, the overall median list price has been pushed down somewhat. Additionally, prior to March 1, new listings — which tend to be more expensive than older listings due to listing strategies and more-frequent price cuts on more-stale listings — were added at a rate of 2.0% of active listings every day. That has fallen to 1.4% of active listings, further contributing to a downward skew in the overall median price.
With that in mind, recent fluctuations in the median list price should probably not be directly interpreted as real changes in home prices (though that cannot be entirely dismissed), and could instead be attributed to a change in composition of those homes currently for sale. The U.S. median list price was up 3.3% year-over-year as of March 1. By mid-April, the median list price was flat with a year ago, and remained up only 0.4%% year-over-year as of May 3.
It is unclear just how much the current crisis will ultimately impact prices — it's reasonable to expect prices may fall somewhat, though the economic push/pull of both a supply shock and a demand shock may provide some insulation. Currently, under the most likely scenario expected by Zillow economists, home prices are expected to fall by 2%-3% from pre-coronavirus levels by year-end, before slowly coming back through 2021 — though the decline could be as steep as 4% or as mild as 1%. Much will depend on how quickly and in what fashion the market reopens, and whether sellers and buyers can reasonably participate again, both financially and logistically.
Update on Inventory
The overall number of active listings on the market has fallen below one million, down 16.7% from a year ago to the lowest level recorded — by far — since Zillow began tracking the data in 2013. New listings are being put up for sale at a rate of about 14,100 per day, a rate more typical of December. After some early signs of recovery in listings, the decline from prior weeks may indicate that listings could be riding a bumpy bottom, and are not yet at the cusp of a sustained recovery. Newly pending listings are up for the week, currently sitting 21% below last year, at about 8600 per day.
Methodology
In this analysis, we segmented the housing market in each metropolitan area into fifths based on home value (using the Zestimate in order to get the most complete universe of home values). The national quintiles are composites of metro-level quintiles, so that tiered effects are not swayed simply by changes in one large, expensive metro. After determining tiers, we observed the daily count of new for-sale listings coming from each tier.
The post In Coronavirus' Wake, Listings of Expensive Homes Fell Farther & Faster than More-Affordable Homes appeared first on Zillow Research.
via In Coronavirus' Wake, Listings of Expensive Homes Fell Farther & Faster than More-Affordable Homes

No comments:
Post a Comment