The Zillow Home Value Index (ZHVI) is Zillow’s flagship measure of both the typical home value as well as housing market appreciation currently and over time. It offers a number of advantages over other housing indices, including better timeliness, better coverage of the market and more visibility into changes in small market segments.
Beginning with publication of November 2019 data, we revised our approach and the calculations made to construct the index. Here’s how it’s built.
Property Universe
Zestimates are the core of the ZHVI. The Zestimate is regularly calculated for more than 100 million individual homes nationwide. The Zestimate is generated through an ensemble of machine learning models and incorporates data from a variety of sources including public data, user-generated data and real estate data from direct feeds or multiple listing services. The Zestimate also accounts for home attributes and geographic location.
This comprehensive and accurate property-level analysis lends unique robustness and timeliness to the ZHVI. The ZHVI is calculated for approximately 90,000 regions in the United States at the following levels:
- Nation
- State
- Metro
- County
- City
- Neighborhood
- ZIP Code
The methodology does not limit itself to geographic cuts. It could be applied to any consistent set of homes, such as those in a securitized mortgage pool, a residential REIT portfolio or a school district's property tax base.
Because the ZHVI attempts to capture appreciation of a market as it existed at a given time, some homes are removed from and added to the property universe in order to account for the evolving and expanding housing stock in an area. For example, while a Zestimate may exist for a home built in 2018, that home is not included as part of the property universe for the ZHVI calculated for 2017 and prior. Homes may also be removed or their appreciation imputed if their Zestimate level or appreciation are on the very high or very low end, or if there are data quality issues.
Weighted Appreciation
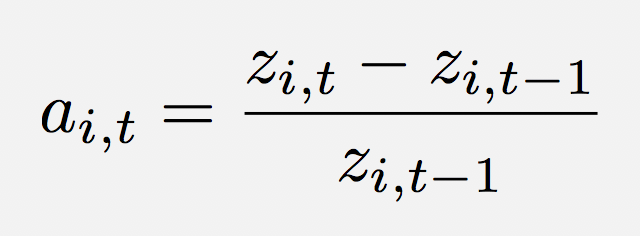
One of the core functions of the ZHVI is to calculate total housing stock appreciation in a market. Total market appreciation is calculated as a weighted average of each home's appreciation in the property universe. The individual home appreciations are calculated using zi,t-1 and ,zi,t, the home's Zestimate at time t-1 and t, respectively.
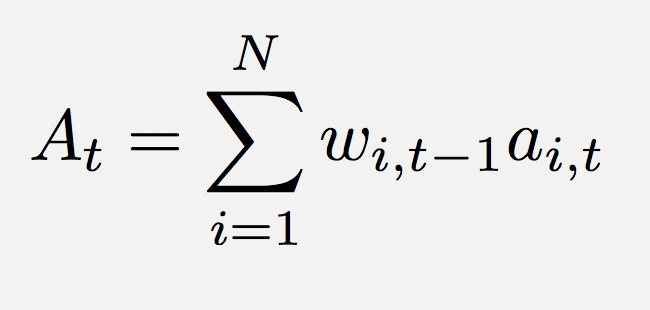
Each individual home's appreciation is then multiplied by a weight, wi,t-1. This weight is the home's Zestimate divided by the sum of all Zestimates in a region, representing that home's share of the total market value. Homes that are more valuable both contribute more to overall appreciation and represent a larger market share. For example, a home worth $100,000 that appreciates 10% month-over-month adds $10,000 in value, while a home worth $1 million that appreciates 10% adds $100,000 in value. And because the more expensive home adds more dollar value, it represents a larger portion of the total market appreciation. The total market appreciation, At, is the sum of the weighted appreciation of each home.

An important feature of the ZHVI is that it captures appreciation solely attributable to market changes, and not from properties adding additional space or improvements — for example, when a homeowner adds an additional bedroom or other addition to their property. To account for these kinds of changes to the housing stock, those properties that do undergo significant physical changes have their appreciation set to the median appreciation for that region and property universe.
Chaining and Seasonal Adjustment
A second important function of the ZHVI is to measure the value of the typical home in every period. To this end, the present-day index level of the ZHVI is set to the mean Zestimate of the property universe at time t. In order to translate the current home value level to the previous time period, the total appreciation is chained backward as follows:
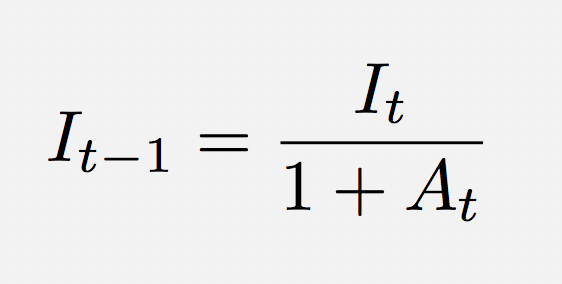
Because the index is chained, we only publish values for periods when we have at least 2 years of data and the latest data point is not suppressed. The index is also seasonally adjusted by applying a centered 12-month moving average to the appreciations before performing the chaining. In addition, the index levels are smoothed using a 3-month moving average.
Tiers
The ZHVI is generally available for three market tiers — a bottom, middle and top, roughly corresponding to one-third of the market apiece. The middle-tier ZHVI encompasses all homes falling between the 35th and 65th percentile of home values. This mid-market range is closest to the standard definition of a "typical" home in an area, and the middle-tier ZHVI will generally be published and commented upon as Zillow's "flagship" ZHVI, tracking general market conditions.
The bottom tier is defined by all homes falling between the 5th and 35th percentiles, and the top tier includes all homes that fall between the 65th and 95th percentile. These percentiles are calculated relative to home types included – the bottom-tier condo ZHVI will include only condominiums that fall between the 5th and 35th percentile values of all condos for a region.
Available Segments
| Bottom-Tier | Mid-Tier | Top-Tier | Mid-Tier Bedroom Cuts (0, 1, 2, 3, 4, 5+) |
|
| SFR Only | Yes | |||
| Condo and Co-op Only | Yes | |||
| SFR, Condo, and Co-op | Yes | Yes | Yes | Yes |
Not all computed series are published, and all are subject to revision. Because of a variety of data quality concerns, some regions and cuts are suppressed and not published. These issues include but are not limited to poor data coverage, anomalous month-over-month change and/or insufficient data history.
The post Zillow Home Value Index Methodology, 2019 Revision: Getting Under the Hood appeared first on Zillow Research.
via Zillow Home Value Index Methodology, 2019 Revision: Getting Under the Hood

No comments:
Post a Comment