- Typical home buyers earn more than 62.7 percent of all U.S. households, up from 59.8 percent in 2012.
- The value of a typical home raced ahead by more than half of an entire year's median U.S. income.
- In 2012, only five of the 35 largest metro areas had a majority of home buyers making more than $100,000 a year: New York, D.C., Boston, San Francisco, and San Jose, Calif. But by 2017, these six markets had joined them: Los Angeles, Dallas, Seattle, San Diego, Denver and Portland, Ore.
Home buyers have historically earned more money, on average, than other households – but the income disparity between those groups at the national level is growing along with climbing home values. Because owning a home has a long-term impact on wealth, that disparity is another way to gauge wealth inequality.
Households that bought a home in 2017 earn more than 62.7 percent of U.S. households overall, up from 59.8 percent in 2012. That means the threshold for being a typical home buyer moved more than 3.5 million households up the income distribution ladder.
When it comes to income, the typical home buyer nationally is starting to resemble buyers in the country's highest-cost metropolitan areas such as Los Angeles (where home buyers earn more than 70.8 percent of all local households), Seattle (65.4 percent) and San Jose, Calif. (72.2).
Incomes not keeping up
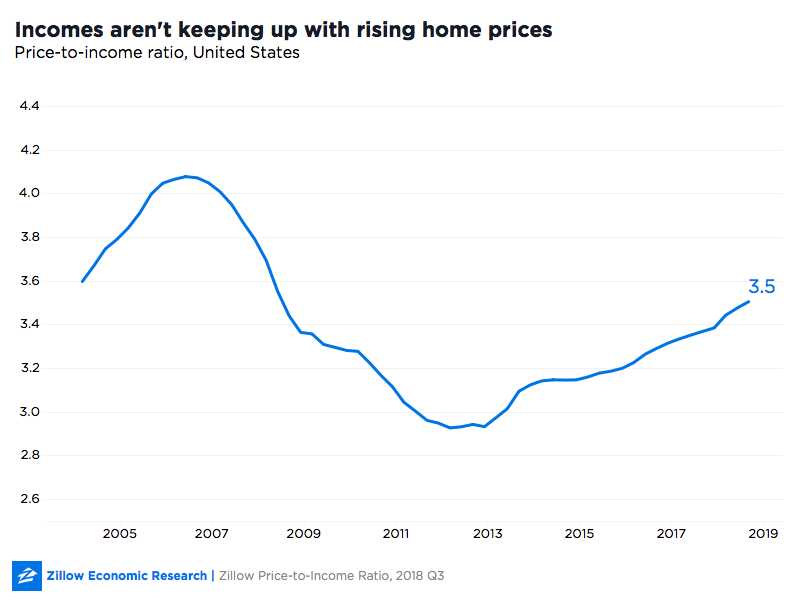
Climbing home values are just one part of the equation. While they have soared 50 percent in the past seven years, household incomes have not kept up, rising just 11.3 percent in real terms ($53,921 to $60,000) from 2012 to 2017. The result is that the ratio of home values to incomes has increased from 2.96 in the third quarter of 2011 to 3.5 in the third quarter of 2018.
In other words, the value of a typical home raced ahead by more than half of an entire year's median income. By this metric, home values have risen to income-adjusted levels last seen in 2008. At that time, prices had risen unsustainably high and were beginning a five-year decline toward their post-crisis trough around early 2012.
Rise of the Six-Figure Buyers
Another indication of the rising affluence of home buyers is the growing share of buying households that earn more than $100,000 a year (adjusted for inflation).
In 2012, only 30.4 percent of home-buying households made more than $100,000 (in 2017 dollars). By 2017, that share had risen to 38 percent. At the other extreme, the share of home buyers earning less than $50,000 fell from 35.5 percent to 27.8 percent. The share of buyers in the middle, earning from $50,000 to $100,000, remained unchanged at 34.1 percent in both 2012 and 2017.
Among all households, owning and renting, the shift toward higher-income households was far less dramatic. Overall, households earning less than $50,000 still comprise the large plurality, at 42.3 percent of households in 2017, down from 46.4 percent in 2012. Meanwhile, the overall share of households making over $100,000 rose from 23.7 percent in 2012 to 27.2 percent in 2017.
Back in 2012, only five of the 35 largest metro areas saw a majority of home buyers make more than $100,000: New York, Washington, D.C., Boston, San Francisco, and San Jose, Calif. But by 2017, six additional markets joined them: Los Angeles, Dallas, Seattle, San Diego, Denver and Portland, Ore. Among these, the Seattle metro area had jumped the furthest, as households earning over $100,000 surged as a proportion of buyers from 37.5 percent in 2012 to 55.7 percent in 2017. The San Diego metro area experienced a jump of 17.9 percentage points, reaching 57.8 percent in 2017.
The post More Than a Third of Home Buyers Now Make More Than $100,000 appeared first on Zillow Research.
via More Than a Third of Home Buyers Now Make More Than $100,000

No comments:
Post a Comment