Home values have grown at a breakneck pace since June, driven by an extreme lack of inventory and incredibly high demand, further cementing the housing market's overall strength amid an uncertain economy. But while for-sale housing remains hot, the rental market just keeps getting colder.
Monthly Home Value Growth Hits Highest Level Since Mid-2000s Housing Boom
- The typical U.S. home value rose to $259,906 in September, up a whopping 0.8% from August — the fastest monthly growth pace since November 2005, in the midst of the last housing boom.
- For the third month in a row, typical home values were up in every major U.S. metro in September compared to August, with increases ranging from 0.5% in Orlando to 1.5% in San Jose. Monthly growth accelerated in 39 of the top 50 metros.
- Home values were up 2.2% from June, the largest quarterly increase since October 2013, and up 5.8% year-over-year. Annual growth was fastest in Phoenix (11.7%), San Jose (11.5%) and Seattle (10.7%).
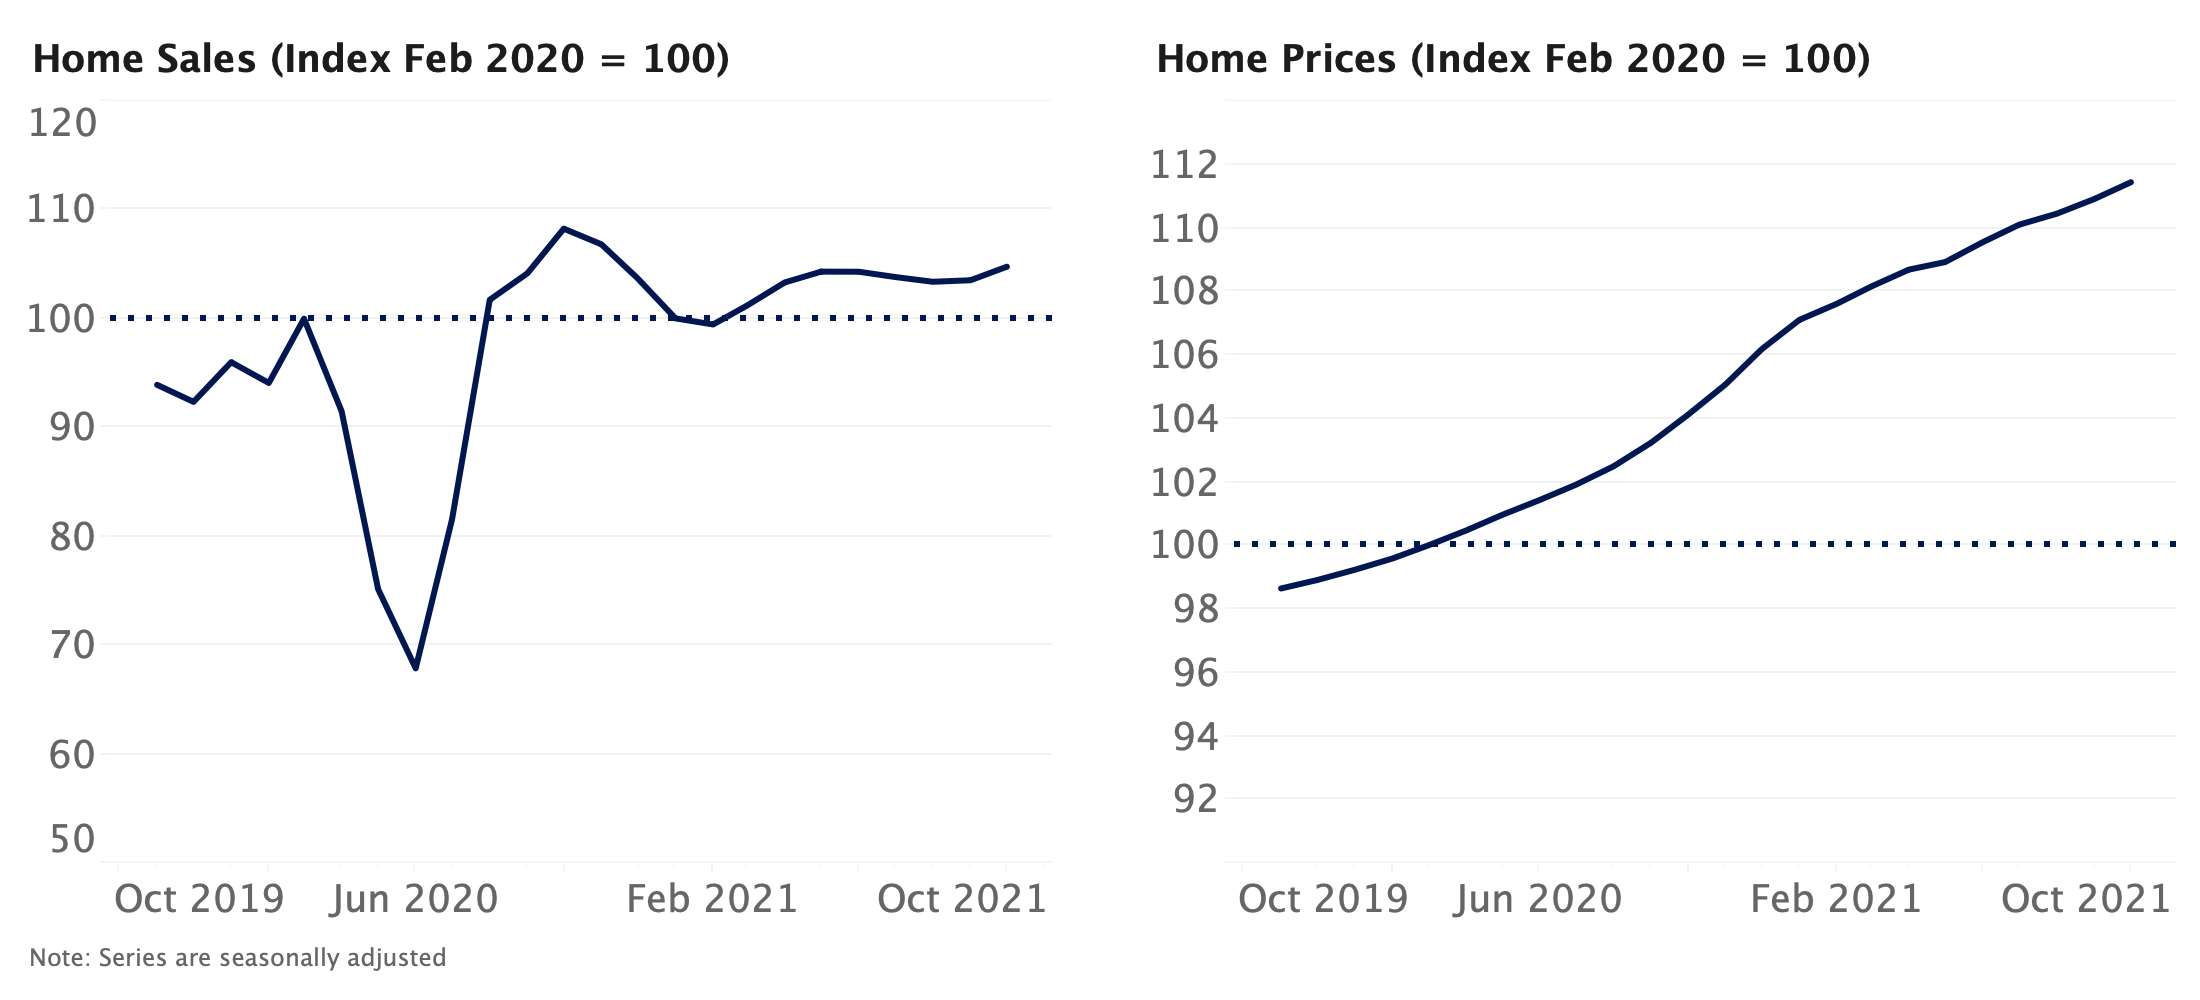
Homes Sold Incredibly Quickly in September, Regardless of Price — Defying Seasonal Norms
- The typical U.S. home sold in just 16 days in September, down from 17 in August and 28 days in September 2019. Among the 50 largest markets, homes sold fastest in Columbus, Cincinnati, Kansas City and Indianapolis (all five days or less), and slowest in Nashville (36 days), New York (28), Virginia Beach (28), and San Antonio (27).
- Entry-level and mid-market U.S. homes (priced from $186,000-$344,000) sold fastest, at 14 and 16 days, respectively. The most-expensive U.S. homes ($488,000 and up) took the longest to sell, at 33 days (down from 47 a year ago).
Rents Continue to Slump, Especially in Pricey Markets
- Typical monthly U.S. rent was $1,756 in September, up just 0.9% year-over-year, the second-lowest annual rate since at least 2015 and well below 4% annual growth rates recorded prior to the pandemic in February.
- Rent was down the most year-over-year in September in some of the nation's priciest rental markets, falling 6% in New York, 5.9% in San Francisco and 4.5% in San Jose. Meanwhile, rents were up strongly year-over-year across much of the Midwest and Sun Belt, with the biggest annual gains among large markets recorded in Memphis (8.7%), Phoenix (7%) and Riverside (6.9%).
- U.S. typical rents fell 0.1% month-over-month, a slightly smaller monthly decline than the 0.5% dip from July to August.
Median List & Sale Prices Continue to Skyrocket
- As of the week ending Oct. 10, the medium list price nationwide was up 11.6% year over year.
- Sale prices are also rising incredibly quickly, in line with list prices: For the week-ending August 29 (the most recent data available), the U.S. median sale price was up 10.2% from the same week in 2019. At the same time, median list price was up 9.2%.
- Two intertwined factors contribute to the recent spike in list prices: (i) sale prices for the most expensive homes are accelerating faster than sales price for less expensive homes; and (ii) the most expensive homes are sitting on the market longer than less expensive homes.
Inventory Continues to Plummet
- For-sale inventory nationwide fell 1.2% week-over-week in the week-ended Oct. 10, and was down 36.4% from a year ago.
- Inventory last week was down year-over-year in all 50 of the nation's largest markets, with the biggest drops recorded in Salt Lake City (-48.3%), Riverside (-47.6%) and Charlotte (-47.1%).
Home value growth expected to continue accelerating in coming months
- We expect seasonally adjusted home values to increase 2.9% between September and the end of 2020, and rise 7% in the 12 months ending September 2021. This forecast is notably more optimistic than previously: Our prior forecast called for a 4.8% rise between August 2020 to August 2021.
- Historically low levels of for-sale inventory teamed with robust buyer demand and mortgage rates that remain near historic lows should continue to place upward pressure on prices.
2020 home sales likely peaked in September, expected to reaccelerate early next year
- Our forecast suggests that closed home sales reached a recent high in September, and will temporarily slow down in coming months, falling to pre-pandemic levels by January 2021. Growth is then expected to resume next spring and to remain firmly above pre-pandemic volume through most of next year.
- This short-term deceleration in sales volume can be attributed in large part to an expected slowdown in GDP growth, the fading impact of historically low mortgage rates, fewer sales occurring that were deferred from earlier this year and historically low levels of for-sale inventory. An expected reacceleration of GDP growth in 2021 should help push sales volumes higher.
Methodology
The Zillow Weekly Market Reports are a weekly overview of the national and local real estate markets. The reports are compiled by Zillow Economic Research and data is aggregated from public sources and listing data on Zillow.com. New for-sale listings data reflect daily counts using a smoothed, seven-day trailing average. Total for-sale listings, newly pending sales, days to pending and median list price data reflect weekly counts using a smoothed, four-week trailing average. National newly pending sales trends are based upon aggregation of the 38 largest metro areas where historic pending listing data coverage is most statistically reliable, and excludes some metros due to upstream data coverage issues. For more information, visit www.zillow.com/research/.
Click here to read past editions of Zillow's Weekly Market Report.
The post September 2020 Market Report & Weekly Market Data (Through Oct. 10) appeared first on Zillow Research.
via September 2020 Market Report & Weekly Market Data (Through Oct. 10)

No comments:
Post a Comment