The housing market is showing signs of seasonal cooling after a scorching hot summer sales season that stretched uncharacteristically far into fall. A nearly six-month acceleration of year-over-year list price increases stabilized this week at 11.7% above 2019. Buyers are quickly buying up what few homes are left on the market, with sales continuing to be dragged down somewhat by increasingly short inventory.
Buyer demand continues to push beyond seasonal norms
- Newly pending sales are up 19.3% since this time in 2019, but slowed 1.5% since last week in the latest installment of a seven-week downward seasonal trend. In the first week of September, newly pending sales were up 23.8% year over year.
- A lack of new inventory and seasonal slowing appear to finally be tempering record sales figures, but weekly pending figures are now similar to those from last April and July — both of which are traditionally strong sales periods.
- Houses are on the market for a median of 12 days before an offer is accepted, which is unchanged from the past two weeks. This is 17 days faster than last year — another effect of strong demand pushing this year's home shopping season past its usual endpoint.
The inventory well keeps getting drier
- The downward slide of inventory that began in late May continued, dropping 1.3% week over week and reaching 37.2% lower than at this time last year. The last time inventory grew year-over-year was at the end of July 2019.
- New listings are down 3.7% from last year and 7.1% from the week prior.
Sales price growth hits new high
- A run of weekly list price increases that began in late April has finally flattened out, with median list prices holding steady at $346,080, and could begin to fall as soon as next week in a typical-though-late decline. List prices climbed from 2.8% above 2019 the week of Feb. 1 up to 11.7% year over year this week.
- The median sale price was $288,225 in the week ending Sept. 12, up 11.4% since 2019 and up 0.2% week over week.
Would-be sellers are confident price growth is here to stay
- A Zillow survey shows general life uncertainty caused by the COVID-19 pandemic and precarious financial positions are the most common reasons people are waiting to list their homes for sale.
- Nearly 40% of those planning to sell in the next three years anticipate a more favorable sale price if they wait, suggesting many homeowners don’t feel pressure to list during today's buying frenzy in order to get a good price.
- While soaring home prices bring challenges for buyers trying to save for a down payment, ultra-low mortgage rates are making monthly payments more affordable for those who can get into a new home.
Home value growth expected to continue accelerating in coming months
- We expect seasonally adjusted home values to increase 2.9% between September and the end of 2020, and rise 7% in the 12 months ending September 2021. This forecast is notably more optimistic than previously: Our prior forecast called for a 4.8% rise between August 2020 to August 2021.
- Historically low levels of for-sale inventory teamed with robust buyer demand and mortgage rates that remain near historic lows should continue to place upward pressure on prices.
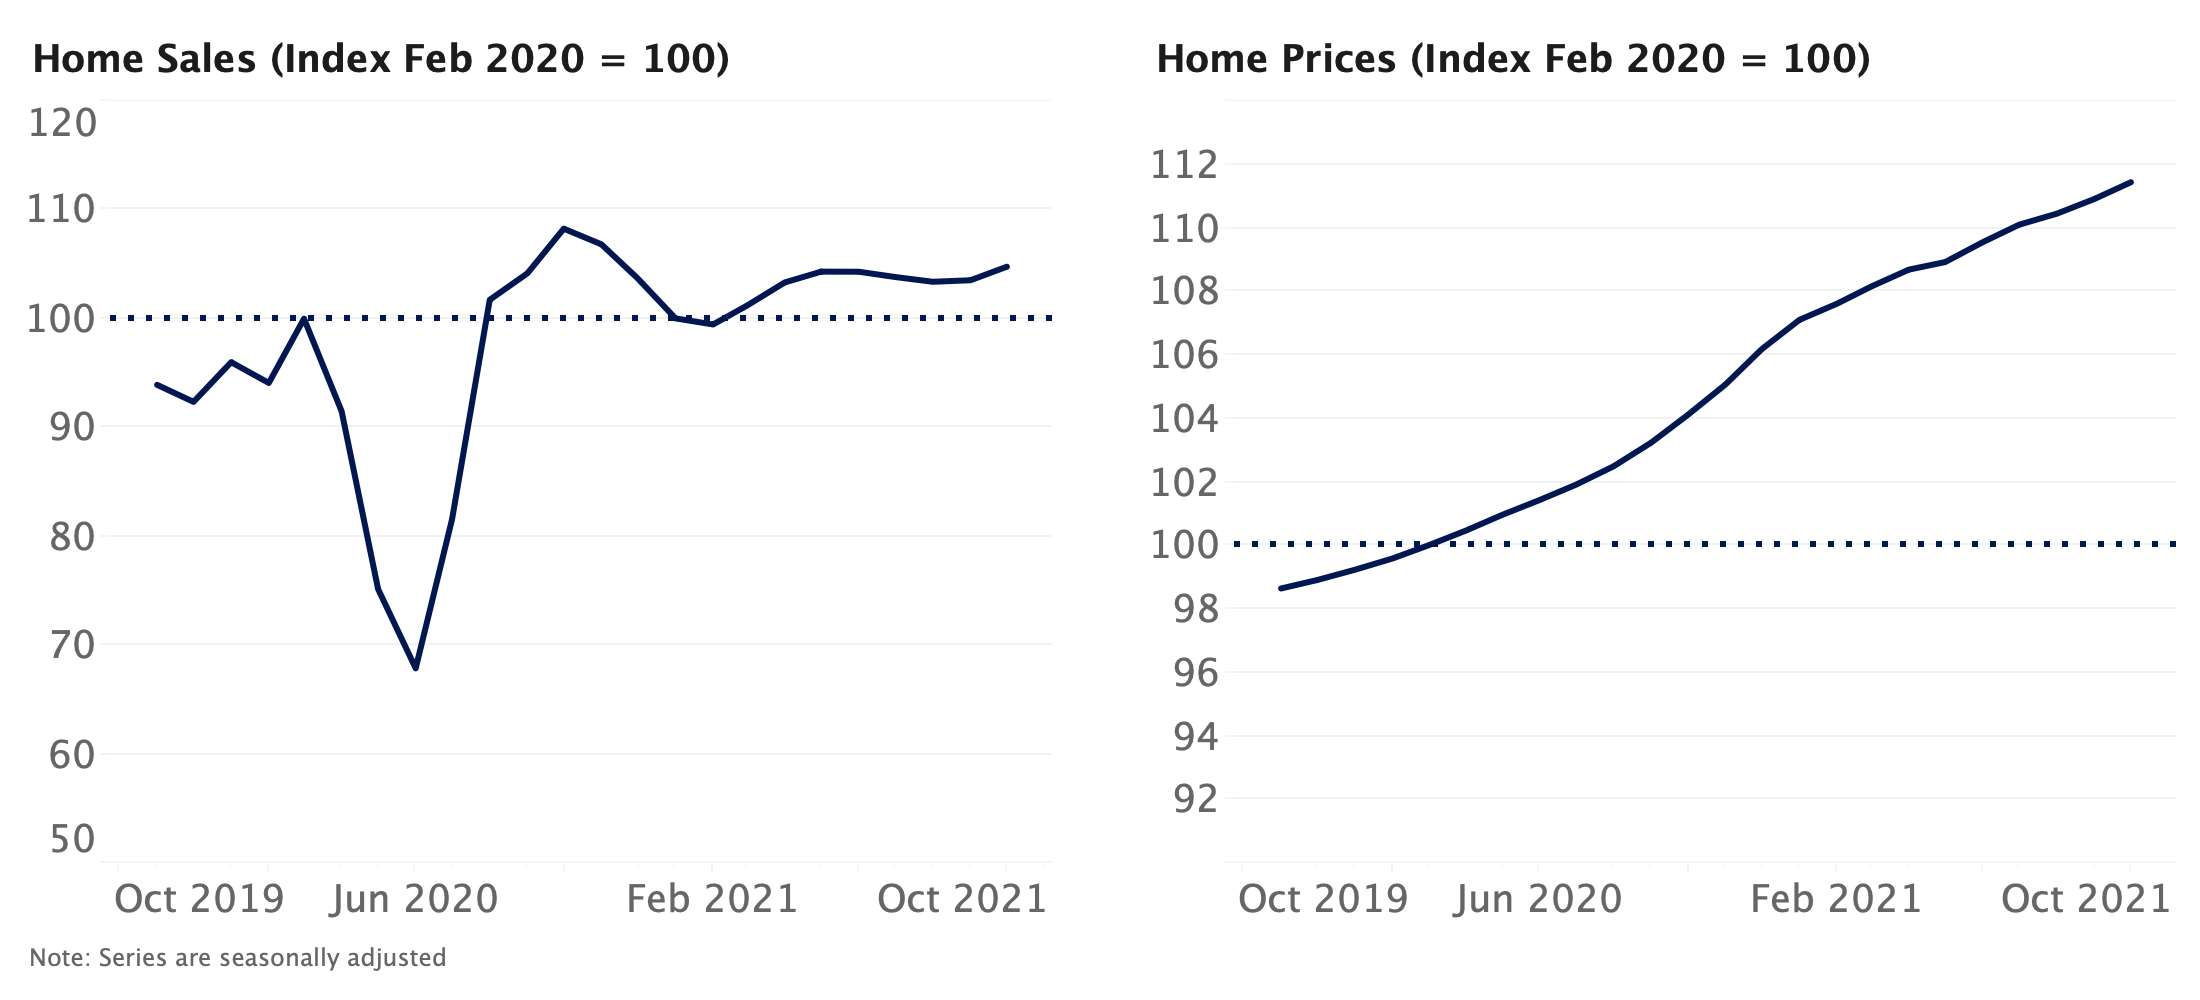
2020 home sales likely peaked in September, expected to reaccelerate early next year
- Our forecast suggests that closed home sales reached a recent high in September, and will temporarily slow down in coming months, falling to pre-pandemic levels by January 2021. Growth is then expected to resume next spring and to remain firmly above pre-pandemic volume through most of next year.
- This short-term deceleration in sales volume can be attributed in large part to an expected slowdown in GDP growth, the fading impact of historically low mortgage rates, fewer sales occurring that were deferred from earlier this year and historically low levels of for-sale inventory. An expected reacceleration of GDP growth in 2021 should help push sales volumes higher.
¹Using the closest daily rates available from the Freddie Mac Primary Mortgage Market Survey. Monthly payments calculated with Zillow's Mortgage Calculator using 20% down payment.
Methodology
The Zillow Weekly Market Reports are a weekly overview of the national and local real estate markets. The reports are compiled by Zillow Economic Research and data is aggregated from public sources and listing data on Zillow.com. New for-sale listings data reflect daily counts using a smoothed, seven-day trailing average. Total for-sale listings, newly pending sales, days to pending and median list price data reflect weekly counts using a smoothed, four-week trailing average. National newly pending sales trends are based upon aggregation of the 38 largest metro areas where historic pending listing data coverage is most statistically reliable, and excludes some metros due to upstream data coverage issues. For more information, visit www.zillow.com/research/.
Click here to read past editions of Zillow's Weekly Market Report.
The post Zillow Weekly Market Report, Data Through Oct. 24 appeared first on Zillow Research.
via Zillow Weekly Market Report, Data Through Oct. 24

No comments:
Post a Comment