The number of days homes are staying on the market remains at a record-low in the face of intense and persistent buyer demand. Sales are at levels not seen since prior to the Great Recession and are expected to remain high, and prices continue to grow quickly.
September was the best month for existing home sales since 2006
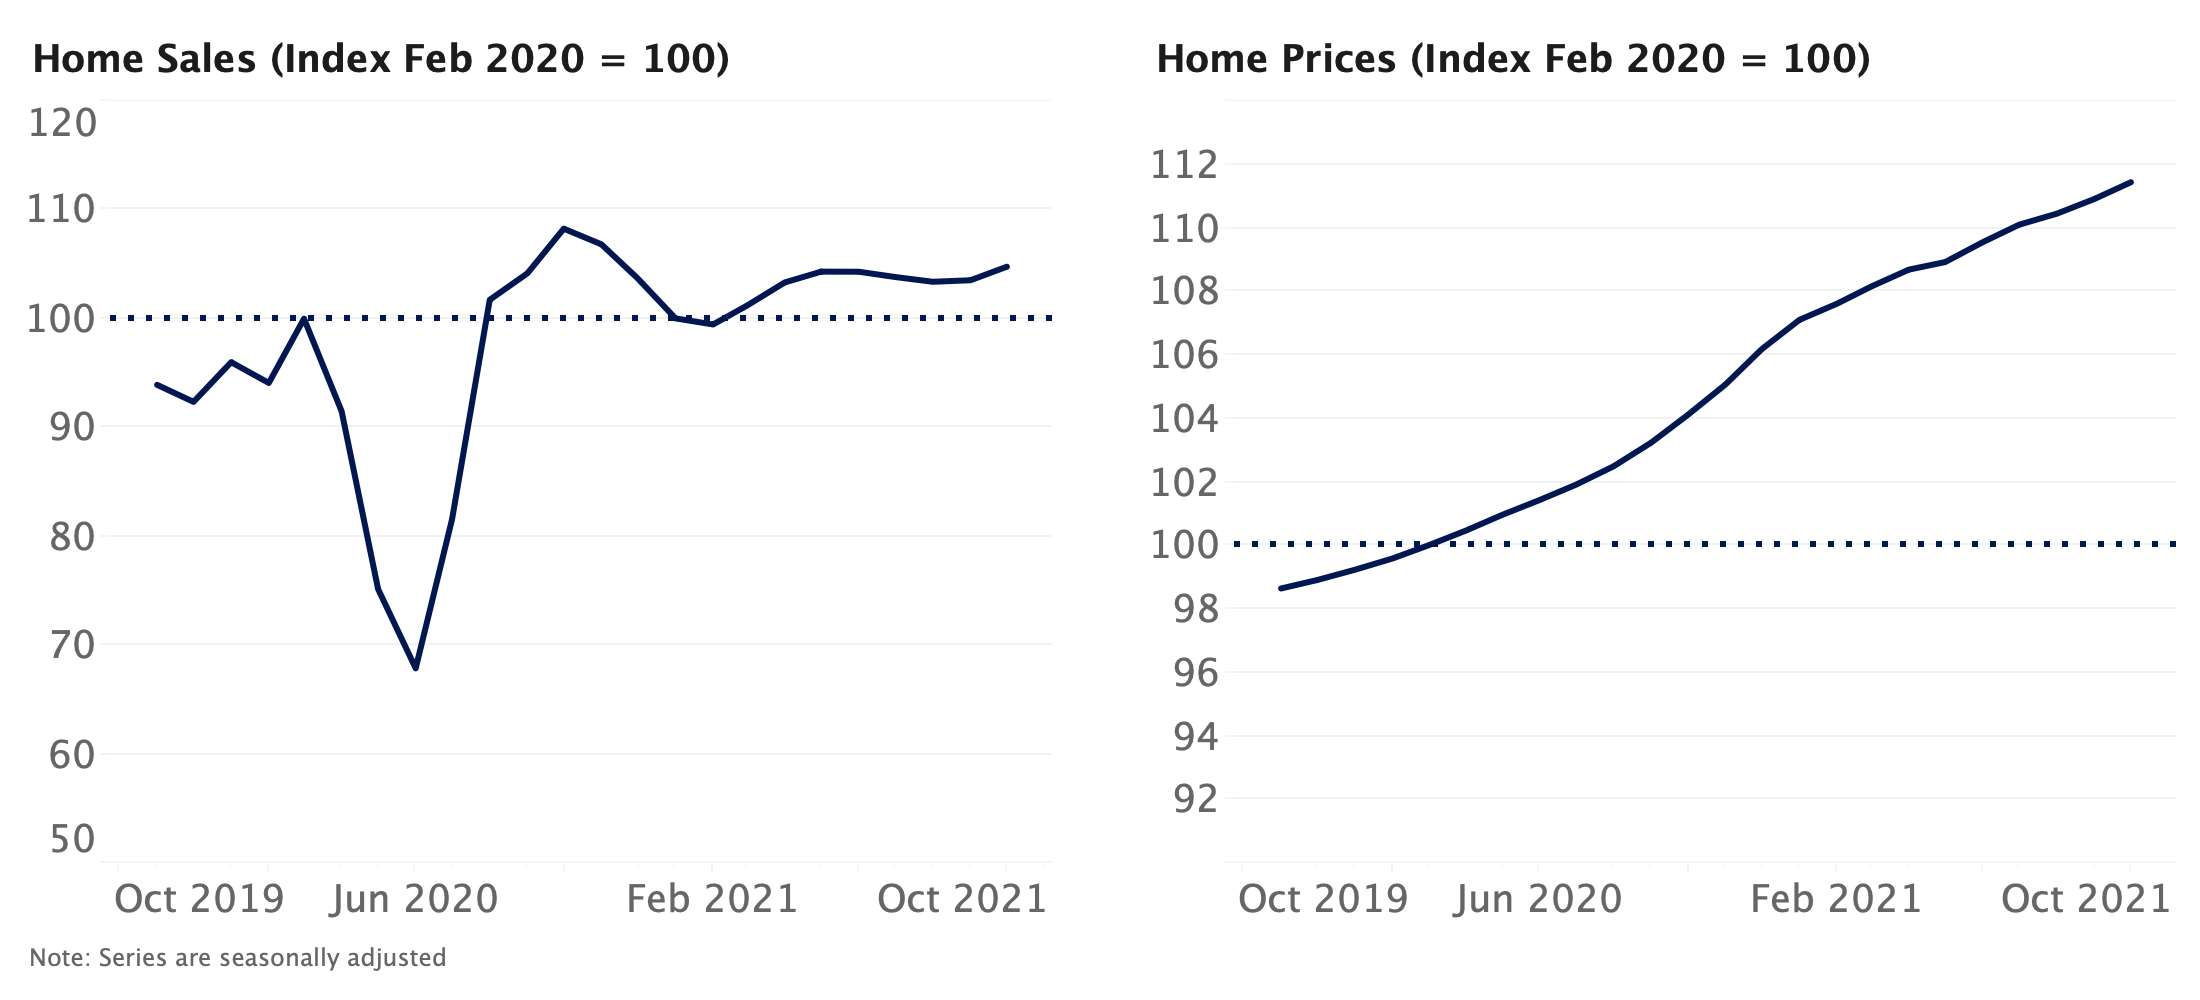
- Closed sales of existing homes continued to grow at a torrid pace in September, rising 9.4% from August and 20.9% year-over-year to a seasonally adjusted annualized rate (SAAR) of 6.54 million — the highest rate recorded in any month since early 2006, according to data from the National Association of Realtors (NAR).
- Buyer demand remains very high and sales volumes are expected to stay elevated in coming months, especially relative to last year. But modest slowdowns in mortgage application and pending sales data indicate sales are likely to recede somewhat in coming months:
- Seasonally adjusted purchase mortgage application activity remains 25% above typical levels seen from 2016 through 2019, but has fallen 7.9% from recent highs in mid-September.
- NAR's seasonally adjusted pending sales index (a leading indicator of closed sales to come in the next 1-2 months) slipped 2.2% in September from August – the first monthly decline since April (though the index remains 20.5% above last September's levels).
Time on market matches record lows
- Robust buyer-side demand persisted through October. For the fourth consecutive week, homes typically stayed on the market for 12 days, a full 17 days faster than the same time last year.
- There were 25,158 listings that went pending last week, similar to volume seen in near-peak buying periods of late April and early July in 2019.
- Pending sales were up 19.7% year-over-year, though they have slowed 3.1% since last month and 1.3% since last week.
Scalding homebuyer demand continues to drive inventory lower
- Available inventory fell for the 23rd straight week and is now down 37.4% compared to last year. Demand for homes is still sky high, and current homeowners cite a lack of confidence in their ability to secure and afford a new home among reasons they're not selling.
- New listings on the market dropped 7.4% year-over-year, and were down 7.9% from the week prior.
Price growth continues months-long stretch of uninterrupted annual growth
- Median list prices have grown year-over-year in every week since early May, and are now up 11.8% from the same period a year ago. Compared to last week, typical list prices were down $500, to $345,500 — the first weekly drop since mid-April.
Homeowners that do decide to sell are realizing big gains. Median sale prices rose to $289,625 in the week ending Sept. 19 (the latest week for which sales price data is available), up 12.5% over the same period in 2019.
Home value growth expected to continue accelerating in coming months
- We expect seasonally adjusted home values to increase 2.9% between September and the end of 2020, and rise 7% in the 12 months ending September 2021. This forecast is notably more optimistic than previously: Our prior forecast called for a 4.8% rise between August 2020 to August 2021.
- Historically low levels of for-sale inventory teamed with robust buyer demand and mortgage rates that remain near historic lows should continue to place upward pressure on prices.
2020 home sales likely peaked in September, expected to reaccelerate early next year
- Our forecast suggests that closed home sales reached a recent high in September, and will temporarily slow down in coming months, falling to pre-pandemic levels by January 2021. Growth is then expected to resume next spring and to remain firmly above pre-pandemic volume through most of next year.
- This short-term deceleration in sales volume can be attributed in large part to an expected slowdown in GDP growth, the fading impact of historically low mortgage rates, fewer sales occurring that were deferred from earlier this year and historically low levels of for-sale inventory. An expected reacceleration of GDP growth in 2021 should help push sales volumes higher.
¹Using the closest daily rates available from the Freddie Mac Primary Mortgage Market Survey. Monthly payments calculated with Zillow's Mortgage Calculator using 20% down payment.
Methodology
The Zillow Weekly Market Reports are a weekly overview of the national and local real estate markets. The reports are compiled by Zillow Economic Research and data is aggregated from public sources and listing data on Zillow.com. New for-sale listings data reflect daily counts using a smoothed, seven-day trailing average. Total for-sale listings, newly pending sales, days to pending and median list price data reflect weekly counts using a smoothed, four-week trailing average. National newly pending sales trends are based upon aggregation of the 38 largest metro areas where historic pending listing data coverage is most statistically reliable, and excludes some metros due to upstream data coverage issues. For more information, visit www.zillow.com/research/.
Click here to read past editions of Zillow's Weekly Market Report.
The post Zillow Weekly Market Report, Data Through Oct. 31 appeared first on Zillow Research.
via Zillow Weekly Market Report, Data Through Oct. 31

No comments:
Post a Comment