Thursday, October 29, 2020

Why the Upscale Suburb of Westfield, NJ, May Be the Scariest Place to Live in the U.S.

Westfield NJ: Watcher house, List house, Addams house

Composite by Erin Culton for realtor.com

Westfield, NJ, a town of grand, restored Victorians and stately mansions perched on tree-lined streets, is the kind of place many folks aspire to one day call home. The downtown features mom and pop shops and bakeries alongside a Williams-Sonoma and Baby Gap stores. Even before COVID-19, busy roads were often closed off so residents could listen to live music while dining outdoors, participate in children’s arts and crafts projects, or take open-air yoga classes. Many who grow up in the affluent suburb, about an hour west of Manhattan, return after college to raise their families there.

The pandemic has boosted its upscale appeal, making it a popular destination for folks escaping nearby cities in search of more space. That’s led to a nearly 13.5% annual surge in home prices, to a median list price of $884,050 in September, according to realtor.com® data.

But most newcomers aren’t immediately aware that Westfield has a macabre side—and a deeply dark history.

A string of high-profile murders has taken place within Westfield’s 6.7 square miles, leaving homes across the city with gruesome footnotes in their property history. They include the sprawling home on a hill where accountant John List murdered his wife, three children, and mother, and then vanished for 18 years—perhaps the most famous “family annihilation” in U.S. history. Then there’s “The Watcher” house, whose new owners were subjected to a campaign of terror by a mysterious letter writer, inspiring a 2016 Lifetime movie and an upcoming Netflix flick.

It seems in nearly every generation, Westfield makes the national news for a sinister crime.

The town’s imposing, Victorian-rich architecture may have even inspired Charles Adams to create “The Addams Family” cartoons, with its spooky mansion and spookier inhabitants.

“It does seem like a lot for a town of 30,000,” says Lauren Barr, editor and publisher of the Westfield Leader, the local newspaper. She grew up here and graduated from Westfield High School in 1998.

But “I don’t think that it has affected the town’s reputation,” she adds.

The thing is, few would expect such heinous acts to occur in such a wealthy, picture-perfect community, says Arthur Lurigio, a criminology and psychology professor at Loyola University Chicago.

The crimes “stand out because of the place,” says Lurigio. “This isn’t supposed to happen. … It’s not a place where you expect violence to occur.”

The infamous ‘Watcher’ house wrenched Westfield back into the spotlight

The previous owners of “The Watcher” house received chilling letters from an anonymous writer.

Clare Trapasso

Westfield’s most recent touch of national infamy was the twisted tale of “The Watcher” house.

A couple purchased the six-bedroom, turn-of-the-century Dutch Colonial for more than $1.35 million in 2014, then spent an additional $100,000 on renovations. But Derek and Maria Broaddus and their three children never moved in.

The family’s nightmare began when they received the first in a series of chilling letters. The anonymous writer claimed to be charged with “watching” the house, just as the writer’s father and grandfather did before. The “watcher” seemed to be particularly interested in the couple’s children, referred to in the letters both as the “young blood” and by their individual names.

“Will the young blood play in the basement? Or are they too afraid to go down there alone. I would [be] very afraid if I were them. It is far away from the rest of the house. If you were upstairs you would never hear them scream,” one of the letters said.

Perhaps most frightening, the writer appeared to be omnipresent and yet nowhere, perhaps hiding in plain sight.

“All of the windows and doors in 657 Boulevard allow me to watch you and track you as you move through the house,” the watcher wrote.

Then later in the same letter: “I pass by many times a day. 657 Boulevard is my job, my life, my obsession. And now you are too Braddus family.”

Another note asked: “Do you know what lies within the walls of 657 Boulevard?”

“It was quite the story at the time,” says newspaper editor Barr. “Everyone put their sleuthing hats on in town. … It was all anyone talked about for a while.”

The Broaddus family found themselves stuck with an expensive home they didn’t feel safe visiting, much less living in.

They sued the former owners of the home, who had received one letter from the watcher a few days before they moved out, but never told the new owners. The case was dismissed. Next, the couple proposed razing the place and selling the lot for two new homes to be built in its place. The idea was soundly rejected by the town’s planning board. The couple resorted to renting out the home.

Last year, the Broadduses finally sold the place for about $959,000, a substantial loss.

So who was the watcher? At various times, different neighbors came under suspicion. Some residents, unhappy with the unwelcome attention placed on their town, even surmised that the Broadduses sent the notes to themselves (which the couple staunchly deny). The mystery has never been solved.

One longtime Westfield resident walking her two dogs by the home on Tuesday morning said interest in the episode had died down.

“It was really intriguing at the time and very scary,” says Rebecca Jezierski, 70, who lives a few blocks away. But “all of a sudden [the letters] just stopped when these new people moved in.”

John List murders his family—and then disappears

Accountant John List murdered his family and then eluded capture for 18 years.

Courtesy of The Westfield Leader

“The Watcher” house would be a creepy enough local legend for one town. But one day a half-century ago, Westfield accountant John List shot his mother, wife, and three children to death in their 19-room Colonial, known as Breeze Knoll.

List struggled to hold down a job, and hadn’t told his family he’d lost his latest one and was broke. Moreover, he felt his family was turning away from the church (he was a devout Lutheran) and toward temptation.

On Nov. 9, 1971, List shot each one, then wrote a letter to his pastor explaining he was saving them from the embarrassment of losing their home and from endangering their place in heaven.

Then List disappeared.

The original List home burned down in a mysterious fire after the List murders.

Courtesy of The Westfield Leader

He created a new identity, remarried, and moved to Colorado. It wasn’t until an “America’s Most Wanted” episode on the murders aired that he was finally caught—18 years after the murders. List died in prison in 2008 at the age of 82.

“People still remember it. When I was growing up, John List was the ghost story,” says Barr. She used to live two streets over from the List property.

During List’s 1990 trial, townspeople would line up outside of the courthouse as early as 6 a.m. to get a seat in the galley.

A wanted poster seeking the capture of John List, who murdered his family.

Courtesy of The Westfield Leader

The home where the List family perished burned down nine months after the murders, in 1972. Locals traded theories about the suspicious fire. Some believed List returned to torch the mansion, says Barr. Others dismissed it as the handiwork of kids—or Satan worshippers. The property was auctioned off late that year to local newspaper publisher Kurt Bauer for a winning bid of $36,100.

The property itself then became the link to another high-profile killing in town, 25 years after the List murders.

Jeffrey Bauer, 48, Kurt Bauer’s brother, was shot by his estranged wife, Meta Bauer, in 1996 at the Westfield Leader, the local newspaper where he was the publisher. She then killed herself.

“It was just another very strange thing to happen in what’s usually a quiet, sleepy town,” says Barr, who did not work at the newspaper at the time.

A new home stands in the spot where List’s home burned down in Westfield, NJ.

Clare Trapasso

Several more murders were committed in Westfield

The List murders weren’t the first case of a local parent killing a child in Westfield. In 1959, 17-year-old high school basketball star Raymond Bailey III was stabbed to death with a kitchen knife by his mother in their home. She then stabbed herself 25 times, but survived.

There were other murders in the tony town as well.

In 1974, Dr. John J. Graff, 56, was killed in a mugging after leaving the local train station. Authorities believed he was on his way home, just three blocks away. No one was ever caught.

Two years later, Lena Triano, 57, was hogtied with electrical cords cut out of her appliances, raped, strangled with a tie from her bedroom blinds, and stabbed multiple times in her Westfield home. It took 36 years for authorities to track down the murderer, Carlton Franklin.

More recently, college student Sohayla Massachi, 23, was abducted from Seton Hall University by her ex-boyfriend in 2000. He brought her to his Westfield apartment and shot her to death.

‘The Addams Family’ creator found creepy inspiration growing up here

Cartoonist Charles Addams grew up in this Westfield home.

Clare Trapasso

Maybe it’s fitting that Westfield’s most famous former resident was cartoonist Charles Addams, known for his dark characters and pitch-black sense of humor, as seen in “The Addams Family.”

His beloved characters grace the windows of the town’s downtown shops at this time of year, and the town’s AddamsFest puts on a series of family-friendly, Halloween events (this year with social distancing measures in place).

Addams was born in 1912 and grew up in a modest home with canvas awnings over the windows near the heart of town. On his walks to school, he passed by spooky, abandoned Victorians said to have inspired the “Addams Family” mansion.

“When Charles grew up, a lot of those houses were empty and rotting and falling apart,” says Kevin Miserocchi, executive director of the Tee and Charles Addams Foundation. (Marilyn “Tee” Addams was the cartoonist’s wife.) “That [Victorian] architecture intrigued him.”

The first “Addams Family” cartoon ran in the New Yorker in the late 1930s, after the cartoonist left Westfield for Manhattan.

Addams biographer Linda H. Davis disputed the rumors the architecture in the “lovely town” of Westfield inspired the “Addams Family” mansion.

“It’s a persistent myth,” says Davis, author of “Charles Addams: A Cartoonist’s Life.” She claims he borrowed architectural details from different buildings he saw and used them in new variations of the mansion. “The house is never drawn the same way twice.”

Cartoonist Charles Addams may have been inspired to create “The Addams Family” mansion by the local architecture.

Clare Trapasso

Why Westfield’s housing market hasn’t been hurt by these tragedies

The pandemic has spurred buyers from nearby cities, like New York City, Hoboken, and Jersey City, to descend on Westfield. Many are searching for big homes with even bigger backyards to ride out the COVID-19 crisis and any new stay-at-home directives. Westfield’s more unsavory history doesn’t often come up in conversations with these soon-to-be residents.

“People coming to Westfield don’t know anything about ‘The Watcher’ house and don’t care about it,” says local real estate agent Scott Gleason, of Re/Max Select. “I haven’t heard about it in town conversations or real estate conversations in a year. … [And] John List is ancient lore.

“They’re not related to our real estate reality,” he says.

Westfield, NJ, is the site of some unsettling events.

Clare Trapasso

“If you have a spate of burglaries or there are armed robberies on the street in the central business district, you might see people wanting to move out,” says criminologist Lurigio.

But that is not the case here.

Westfield received an A-plus crime rating from AreaVibes, which evaluates the best places to live. It had 96% less violent crime and 71% less crime overall than the national average, according to the site.

“Lots and lots of people want to live here,” says Gleason.

Victorian homes abound in Westfield, NJ.

Clare Trapasso

The post Why the Upscale Suburb of Westfield, NJ, May Be the Scariest Place to Live in the U.S. appeared first on Real Estate News & Insights | realtor.com®.


via Why the Upscale Suburb of Westfield, NJ, May Be the Scariest Place to Live in the U.S.

Wednesday, October 28, 2020

Zillow Market Pulse: October 26, 2020

October 26, 2020

New home sales slipped slightly in September, but remain incredibly strong overall. The stock market suffered its worst day in a month as coronavirus case counts surged to new highs. And protections for renters are being challenged in court.

New home sales fall short of expectations, but remain elevated

  • September new home sales fell 3.5% from August, but were up 32.1% from a year ago, to 959,000 (SAAR) according to the U.S. Census Bureau.
  • There were 3.6 months' of supply of new homes available for sale in September.

Financial markets reels as coronavirus cases surge

  • New COVID-19 cases are rising in the U.S. at their fastest pace yet – more than 83,000 new cases were reported on Friday.
  • The development, plus stalled negotiations around fiscal relief, caused the S&P 500 to suffer its worst loss in a month.

Eviction moratoriums are being met with some pushback

  • A national eviction moratorium announced in September is being challenged in court in a case supported by the National Apartment Association.
  • A win for the plaintiff could force evictions to rise sharply.

So what? 

September new home sales fell somewhat short of expectations and represent a small decline from prior months - but at just shy of 1 million sales for the month (at a seasonally adjusted annual rate), it’s clear the new home market overall remains very strong. Year-to-date, new home sales are up 16.8% from the same nine-month period in 2019. A favorable mortgage interest rate environment, an enduring desire for brand-new homes and a longstanding shortage of existing homes available for sale continue to pay dividends for home builders. And builders are clearly taking notice – their expectations for sales volume over the next six months are the highest they've ever been. The question now is whether these goods times can continue and for how long. A lasting inventory drought matters less for new home sales than for the re-sale market – roughly two-thirds (67.6%) of new homes purchased in September weren't even built yet. But broader economic and social factors including persistently high unemployment and the spread of the coronavirus represent considerable potential constraints for new home sales. For now, though, these issues don't seem to be much of a threat to what continues to be a very solid run for new home sales.

Data compiled by Johns Hopkins University showed that the number of new daily COVID cases in the U.S. has risen by an average of just under 69,000 over the last week, a new record and up about 22% from a week ago. Experts acknowledged that testing volume has increased, which would drive up positive numbers on its own, but suggested that this alone can't explain the strong uptick. Daily new case counts are now at record-high numbers in more than 20 states, most of which are concentrated in the Midwest. This surge coincided with talks surrounding the next round of fiscal stimulus coming to a halt — and financial markets clearly took notice. On Monday, the S&P 500 recorded its biggest one-day drop in more than a month. Equity indices overseas fell similarly, and some fears emerged that Europe may be headed towards a double dip recession. As the pandemic nears the end of its seventh month, the developments are a stark reminder of the strong hold the coronavirus still has over the economy. 

The federal government issued a national moratorium on rental evictions last month, allowing renters nationwide to file for up to four months of rent payment suspension if their economic well-being had been damaged as a result of the pandemic. But reports suggest that many evictions are still taking place and the eviction ban has been met with a slew of legal challenges in the weeks since. A recent hearing of a case against the moratorium has been supported by the National Apartment Association, a group that represents 85,000 landlords responsible for 10 million rental homes. A ruling in the favor of the plaintiffs could offer landlords more flexibility to work around similar moratoriums and potentially prompt a surge in evictions in coming weeks. As of October 12, more than 8 million households were not caught up on rent payments, according to the Census. 

Click here to read past editions of Zillow’s Market Pulse updates.

The post Zillow Market Pulse: October 26, 2020 appeared first on Zillow Research.


via Zillow Market Pulse: October 26, 2020

Housing Affordability Methodology, 2020: A Bayesian Approach to Predicting Incomes

Past attempts at quantifying housing affordability suffered problems of both timeliness and specificity: Current housing costs were divided by literally years-old income data; and broad, median household income data was aggregated across two groups — homeowners and renters — with very different income profiles. 

Traditional housing affordability measures based on income data from the American Community Survey (ACS) do not provide clear insight into the current state of affordability because comprehensive ACS data are published at a lag: Data for 2019, for example, is only just now being published, in late 2020. And while current income data is available through the Bureau of Labor Statistics (BLS), it is also aggregated data and does not discriminate between renter household income and homeowner household income.  While BLS data do provide significant detail on industry specific incomes, industry-specific income data presents its own set of challenges for estimating renter and homeowner incomes separately, since the mix of renters and homeowners in each industry may vary significantly across different metropolitan areas.  

Zillow's new statistical models aim to address these challenges by predicting renter and homeowner incomes forward from their last published observation, and applying them to current housing costs. We publish this housing affordability data — measured as the share of a typical renters' income spent on typical area rent, and the typical homeowners' income spent on a mortgage for the typical local home — for 100 metropolitan areas and the United States as a whole. 

Our models include ACS data, the Zillow Observed Rent Index (ZORI), the Zillow Home Value Index (ZHVI) and earnings data from the Bureau of Labor Statistics. The final output (in this example, for renters) is based on this simple equation (with the numerator for homeowners substituted with observed Zillow Home Value Index for a given month):

The estimated monthly rent in the numerator is a weighted average of the reported contract rent in ACS microdata and Zillow's Observed Rent Index (ZORI).  The weights are the percentage of renters who reported moving in the last 12 months (reported via the MIGRATEPCT variable in ACS microdata). Our estimated monthly rent is:

Our goal is to compute the most timely measure of rent paid by the typical renter in each metro, and we include both ZORI and ACS data to leverage the strengths of different sources of information.   

We predict ACS renter incomes in months where it is not directly observed using a Bayesian statistical model — both in months between the annual releases from 2014 to 2018 and months since the last release in 2018. Our Bayesian model provides the statistical machinery to incorporate multiple sources of information and update predictions as new data is released.  Our model depends on observed ACS renter income and observed BLS income data. From a statistical standpoint, our main objective is to compute the posterior predictive distribution:

Where:

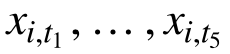
  •  is monthly renter income from January of 2014 to September of 2020.
  •  is the subsequence of renter incomes corresponding to ACS observations reported annually for 2014 – 2018
  •  is the observed BLS monthly earnings data.

We model , the BLS reported income, as the sum of the renter income latent variable, and latent factor , the metro-specific deviation in general earnings from renter earnings. Latent factor  follows a dynamic linear model with a second-order polynomial structure: 

The model for latent renter income  has three components:

  1. intercept , the expected renter income in December 2013
  2. global trend , the expected monthly increase in renter incomes
  3. a flexible function that models nonlinear deviations in renter income from the linear regression   +


Function  follows a Gaussian Process prior distribution and has a very important property for this application: the uncertainty intervals in predicted renter incomes widen as the time elapsed from the last observed renter income increases.  Overall, this latent renter income model is:

Model parameters are estimated with a custom Markov chain Monte Carlo algorithm, and we compute full predictive probability distributions of renter incomes and rent affordability rather than single point estimates.  Given that these estimates are statistical in nature, we believe quantifying the uncertainty in our affordability calculations is an important part of the analysis, and predictive intervals provide additional context to the state of housing affordability in the United States. 

We follow a similar process to calculate homeowners' incomes based on ACS and BLS data. Monthly costs for homeowners assume the buyer is purchasing a home valued at the typical level for a given metro (as measured by the Zillow Home Value Index), is putting down 20%, and is assuming a 30-year, fixed-rate mortgage at prevailing rates (as measured by Freddie Mac). We also make adjustments for local taxes and homeowner insurance costs.

The post Housing Affordability Methodology, 2020: A Bayesian Approach to Predicting Incomes appeared first on Zillow Research.


via Housing Affordability Methodology, 2020: A Bayesian Approach to Predicting Incomes

Tuesday, October 27, 2020

August Case-Shiller Results and September Forecast: No Signs of Cooling

  • The S&P CoreLogic Case-Shiller U.S. National Home Price Index® rose 5.7% year-over-year in August (non-seasonally adjusted), up from 4.8% in July.
  • Annual growth was up from July in the smaller 20-city index (to 5.2%, from 4.1%) and 10-city index (to 4.7% from 3.5%).
  • Phoenix (+9.9%), Seattle (+8.5%), and San Diego (+7.6%) reported the highest year-over-year gains among markets in the 20-city index.

The remarkable surge in home prices continued into August as prices showed no signs of cooling down heading into the fall.

The national Case-Shiller Home Price Index rose 5.7% year-over-year in August. The smaller 10- and 20-city composite indices grew more slowly, at 4.7% and 5.2% year-over-year, respectively. The annual rate of growth was faster in August than in July in all three main indices. On a monthly (seasonally adjusted) basis, the 10- and 20-city indices were each up 0.5%, and the national index was up 1% from June.

Zillow Forecast, Released 9/30/20 Actual Case-Shiller Indices,
Released 10/27/20
Historical Median Absolute Error*
10-City Composite,
Month-Over-Month (SA)
0.4% 1.1% 0.2%
10-City Composite,
Year-Over-Year (NSA)
3.9% 4.7% 0.2%
20-City Composite,
Month-Over-Month (SA)
0.4% 1.1% 0.2%
20-City Composite,
Year-Over-Year (NSA)
4.5% 5.2% 0.1%
U.S. National
Month-Over-Month (SA)
0.4% 1.1% 0.1%
U.S. National
Year-Over-Year (NSA)
5.3% 5.7% 0.1%
*Calculation of Median Absolute Errors are based on Zillow’s forecasts dating to 2011.  The national Case-Shiller forecasts began in 2014.

By some measures, home prices are rising at a faster pace than they ever have – an incredible feat considering the market is rising from an already elevated level. The supply of for-sale homes, already extremely tight, has only become more constrained in recent months, and historically low mortgage rates continue to encourage many buyers to enter the market. This heightened competition for the few homes on the market has placed consistent, firm pressure on home prices for months now, and there are few signs that this will relent any time soon. While the path of the overall economy is likely to be most directly dictated by coronavirus-related and political developments in the coming months, recent trends suggest that the housing market – which has basically withstood every pandemic-related challenge to this point – will continue its strong momentum in the months to come.

Annual growth in September as reported by Case-Shiller is expected to accelerate in all three main indices. S&P Dow Jones Indices is expected to release data for the September S&P CoreLogic Case-Shiller Indices on Tuesday, November 24.

Index Actual August
Case-Shiller Change
Zillow’s Forecast for the Case-Shiller Sept. Indices
10-City Composite,
Month-Over-Month (SA)
1.1% 0.7%
10-City Composite,
Year-Over-Year (NSA)
4.7% 5.7%
20-City Composite,
Month-Over-Month (SA)
1.1% 0.7%
20-City Composite,
Year-Over-Year (NSA)
5.2% 6.2%
U.S. National
Month-Over-Month (SA)
1.1% 0.8%
U.S. National
Year-Over-Year (NSA)
5.7% 6.6%

Note: Case-Shiller and Case-Shiller Index are registered trademarks of CoreLogic Solutions, LLC. The statements herein are not endorsed by or provided in association or connection with CoreLogic, LLC.

The post August Case-Shiller Results and September Forecast: No Signs of Cooling appeared first on Zillow Research.


via August Case-Shiller Results and September Forecast: No Signs of Cooling

Financial Anxiety, Ongoing Uncertainty Keeping Sellers on the Sideline

  • About a third of homeowners who are considering selling in the next three years cite life being too uncertain right now (34%) and financial uncertainty (31%) as reasons they aren't selling.
  • Nearly 40% of these potential sellers say they anticipate a higher sale price if they wait.

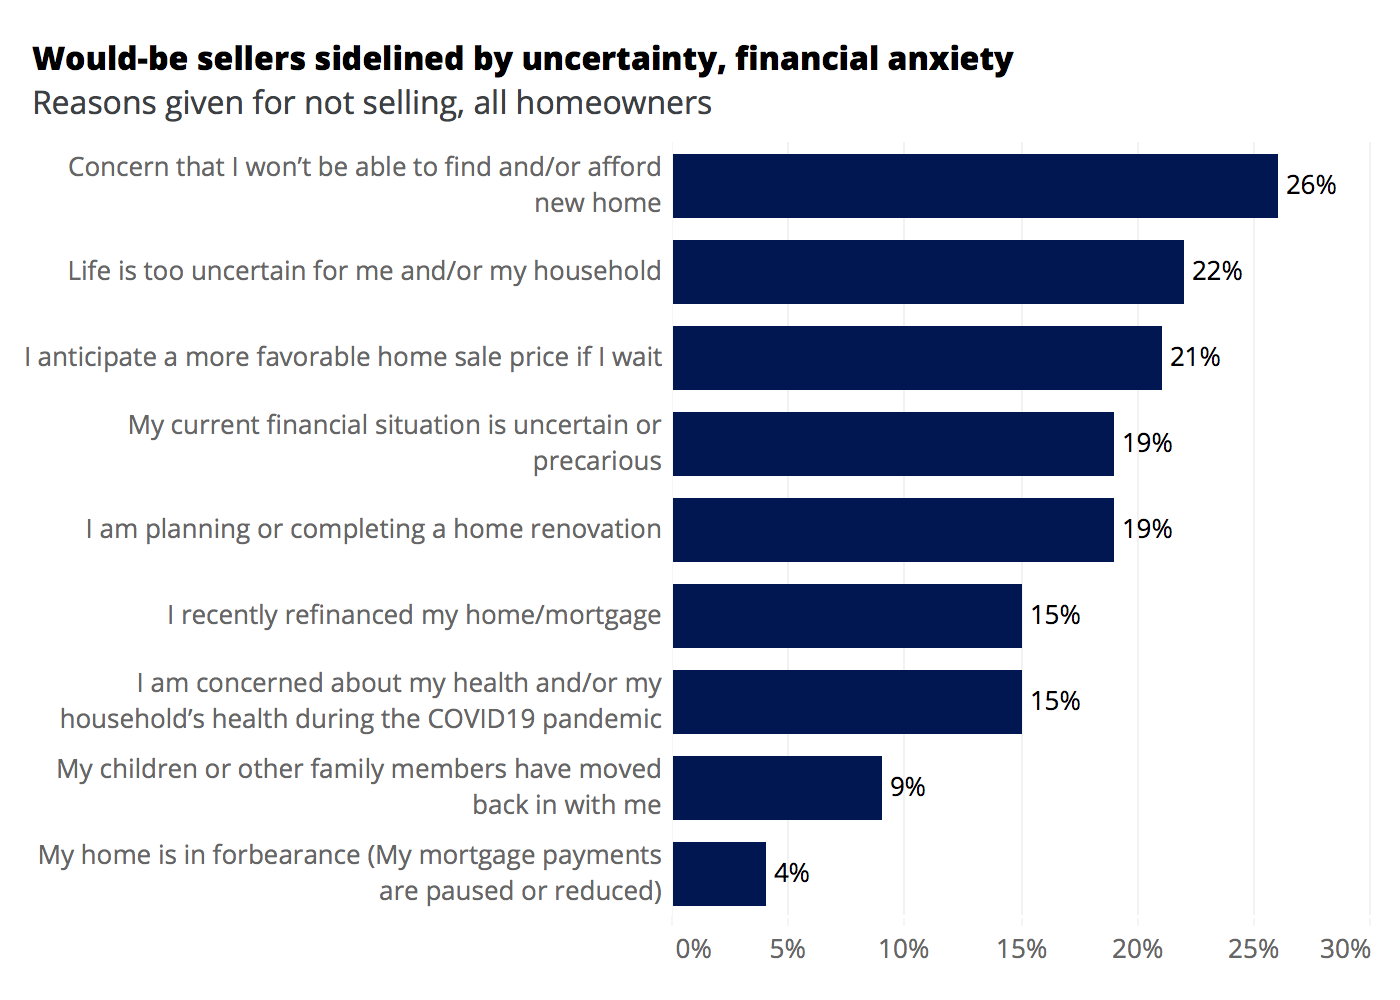
Despite a market tilted decidedly in their favor — with demand sky-high and inventory at rock bottom — potential home sellers are largely staying on the sidelines, citing a variety of personal financial, lifestyle and/or health concerns as major reasons.

Only 1% of homeowners recently surveyed by Zillow said their homes were currently listed for sale. Among the 99% whose homes are not on the market, more than a quarter (26%) said they were concerned they would not be able to find or afford a new home once their current home was sold, the most commonly cited reason for not selling. General life uncertainty (22%) was the second-most common reason, followed by anticipation of a more favorable sale price if they wait (21%).

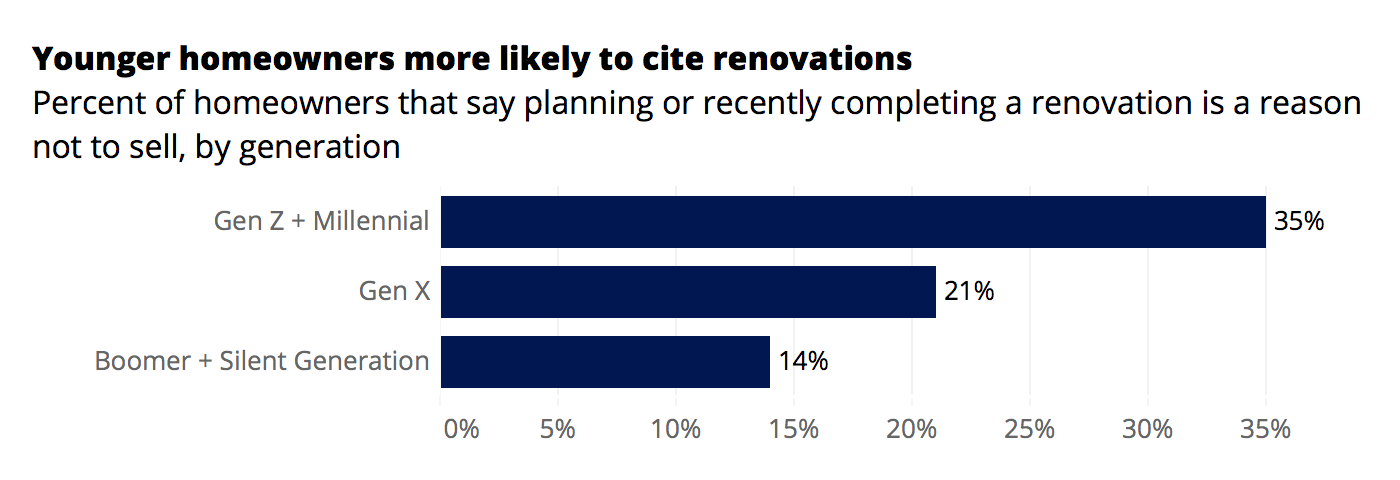
Reasons for not selling vary by age group: More than a third (35%) of Gen Z and Millennial homeowners said their plans for or completion of a home renovation was a main reason to stay put, compared to just 21% and 14% of Gen X and older homeowners, respectively. Younger homeowners were also more likely to cite concern about COVID-19 (20% of Gen Z and Millennial and 18% of Gen X) as a reason for not selling than Boomer and Silent Generation homeowners (11%).

Some homeowners realistically may simply enjoy their current home and have no need or desire to sell and move any time soon. But among homeowners considering selling within the next 3 years, 39% said they anticipate a better price if they wait. Among those who are not currently considering selling, but may be open to it after 3 years, 39% cite concern that they won't be able to find or afford a new home.

Concern over finding or affording a new home among those more likely to sell in the near-term was a bit more muted, but still very real: Almost a third (31%) of homeowners considering selling in the next three years say their plans are paused because they are concerned about finding or affording a new home. The findings are a clear example that selling a home can sometimes cut both ways: According to the 2020 Zillow Consumer Housing Trends Report, almost two-thirds (63%) of sellers are also buyers. But while these dual-track homeowners may be able to sell their home for top dollar, they will also turn around and enter an extremely competitive buyers' market where homes are going under contract in 12 days.

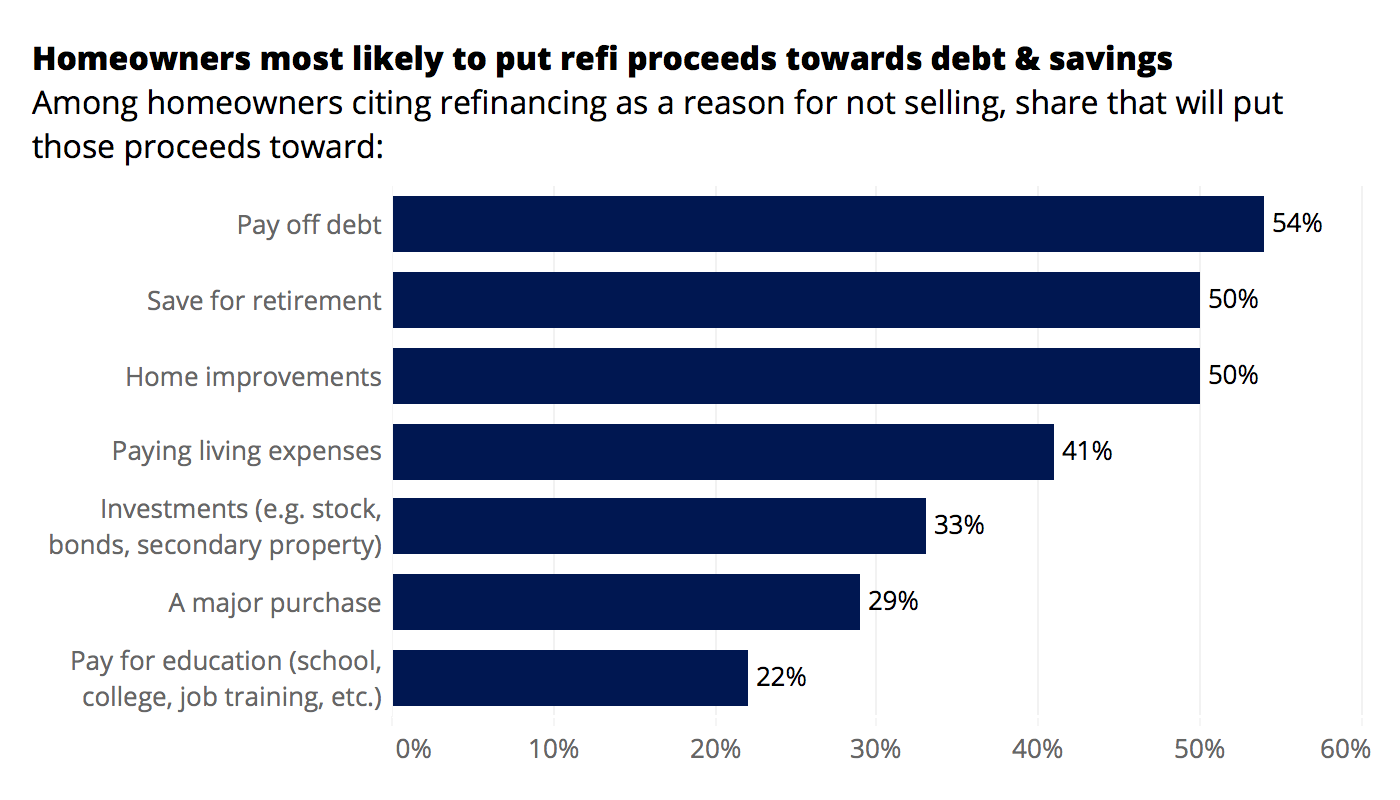
Given the historically low mortgage interest rates that many home buyers and homeowners can enjoy these days, it may come as little surprise that 15% of homeowners report a recent refinance as a reason for staying put — but their planned uses for their newfound financial flexibility are very different. Among respondents that cited a recent refi as a reason to stay put, a majority (54%) said they would use their savings to pay off debt. Exactly half said they would use the savings for home improvements or saving for retirement.

General life uncertainty, especially given the ongoing pandemic, high unemployment and volatile economic conditions, is a main factor keeping more than a third (34%) of those considering selling in the next three years out of the market. Among these homeowners hesitant to put their home on the market now, a quarter said they weren't selling because they were concerned about their household's health and safety during the pandemic.

Financial anxiety, again likely attributable at least in part to the pandemic, is another big factor keeping those that might sell sooner on the sidelines: 31% of homeowners considering selling in the next three years said a currently uncertain or precarious financial situation is a reason to stay put. More than a quarter of these would-be sellers (27%) reported a recent change in employment with a decrease in hours or pay, and 17% said they or their spouse/partner were laid off or involuntarily unemployed. Among sellers who may be considering putting their home on the market in the next three years, 6% said they are currently taking advantage of mortgage forbearance programs that allow them to delay or defer monthly mortgage payments.

Methodology

In this brief, "homeowners" refer to household decision makers who own their primary residence and have not moved in the past year.

Zillow Group Population Science collected a nationally representative sample of more than 1,000 homeowners (household decision makers that own their home and did not move in the past year). From September 29th to October 5th, 2020 the survey asked homeowners questions about their plans to sell and recent life events. Among those who did not have their home listed for sale (99% of the sample), the survey also asked why they were not currently selling.

To achieve national representativeness, quotas for age, ethnicity/race, education, income, region, relationship status, and sex limited oversampling of any given demographic group. In addition to quotas, ZG Population Science used statistical raking to weight the sample to the US Census Bureau American Community Survey 2018 sample of homeowners. Weighting used the same variables as the quotas. Margins of error are at a 95% confidence interval.

The post Financial Anxiety, Ongoing Uncertainty Keeping Sellers on the Sideline appeared first on Zillow Research.


via Financial Anxiety, Ongoing Uncertainty Keeping Sellers on the Sideline

Monday, October 26, 2020

Zillow Market Pulse: October 23, 2020

October 23, 2020

Existing home sales kept their summer surge rolling into September. Mortgage rates have increased recently, but by less than other data would suggest. And U.S. business activity rose strongly in October, raising hopes for a solid fourth quarter.

Existing home sales stayed hot in September

  • September existing home sales rose to 6.54 million (SAAR), up 9.4% from August and 20.9% from a year ago, according to the National Association of Realtors.
  • The median existing-home price in September was $311,800, up 14.8% from September 2019.

Stimulus talks and progress on virus treatment pushing U.S. Treasury yields up

  • The yield on the U.S. 10-year Treasury has risen steadily in the last week, and now sits at its highest level in 4 months.
  • Mortgage rates have also moved upward, but only slightly.

Business activity improved in October

  • The IHS Markit U.S. Composite Purchase Managers Index (PMI) – a measure of business conditions – rose 1.2 points from September to October, to 55.5.
  • A comparable index for the eurozone fell to 49.4 in October, suggesting activity abroad is contracting.

So what? 

The impressive run for existing home sales continued into September, as buyers stayed their course in the face of the ongoing pandemic and an unrelenting inventory shortage. Building on an already strong pace set in July and August, sales figures in September rose at their fastest annual rate since 2010, when the housing market was just beginning its slow recovery from the Great Recession. Red-hot competition for the few homes available – fueled, in part, by low mortgage rates and a wave of millennials graduating into their home-owning years – has placed remarkable upward pressure on prices, particularly for single-family homes. Annual growth of single-family home prices has risen by more in the last three months than in any previously recorded period dating back to 1969. This torrid growth in sales may ultimately be done in by an inventory crunch that's only getting worse - its hard to keep setting sales records when there's so little for sale - forcing a slowdown in transactions in the coming months. But with demand for housing as high as it is, it's unlikely that a slowdown in sales will be substantial.

Recent optimism surrounding discussions about a new fiscal spending package, as well as positive developments regarding an approved treatment for COVID-19, are among the factors that have prompted a steady increase in U.S. Treasury bond yields over the last few weeks. The current yield on the U.S. 10-year Treasury bond sits at about 0.83% — still historically low, but the highest level in four months. Normally, an increase in Treasury yields would coincide with rising mortgage rates — but while mortgage rates have trended higher in the last week, the upward movements have been modest. One reason is that the normally-reliable relationship between Treasurys and mortgage rates has frayed during the pandemic: Mortgage rates have remained very low for the past several months, but they aren't as low as Treasury yields suggest they should be. The surge in mortgage demand has forced many lenders to keep rates higher than they otherwise could in order to keep the volume of requests manageable and also account for perceived levels of risk. While this limits the potential for mortgage rates to move notably lower, it also limits the risk of a sharp uptick in mortgage rates should this upward momentum in Treasury yields accelerate.

The IHS Markit PMI's October reading of 55.5 was its highest since February 2019 (any reading greater than 50 suggests conditions are improving from the previous month). But the report wasn't all rosy — companies noted that demand slowed slightly in October from September, particularly from overseas buyers. New business growth in the services sector also took a slight step backward on the month, continuing to improve but at a slower rate than in September. Still, these minor setbacks don't appear to have derailed business optimism – confidence in both the U.S. services and manufacturing sectors improved in October to their highest levels since May 2018. The picture overseas, meanwhile, is far less optimistic. Surging case volumes across Europe have placed new restrictions on commercial activity and prompted some fears of a double-dip recession. So while the improved business outlook is undoubtedly good news, developments elsewhere are a reminder that the virus will continue to dictate the path forward for the economy.

Click here to read past editions of Zillow’s Market Pulse updates.

The post Zillow Market Pulse: October 23, 2020 appeared first on Zillow Research.


via Zillow Market Pulse: October 23, 2020

9 Presidential Lawn Signs That’ll Make You (and Your Neighbors) Laugh

lawn sign

Etsy

With an epic Election Day coming up on Nov. 3, many homeowners may be inspired to express their political hopes and dreams by planting a presidential yard sign on their front lawn.

But is that really a good idea?

Given how dicey and divisive this political cycle has been, maybe we don’t need another reminder to vote for President Trump or former Vice President Joe Biden, because, let’s face it, a lawn sign won’t change anyone’s mind.

However, we think it’s safe to say that what we could all stand for is a little levity and laughter right at this point. It turns out that there are plenty of lawn signs that can deliver!

If you want to express your state of mind, while keeping politics out of it and preserving your relationship with your neighbors, consider getting one of these funny, fairly inoffensive lawn signs below. They’re guaranteed to get a chuckle from all who pass by without ruffling any feathers.

1. For those who just can’t take it anymore

Pandemic cry for help

Etsy

No matter where you fall on the political spectrum, we can all agree that this year has been rough.

Between a global health crisis (we’re looking at you, coronavirus), devastating natural disasters, an economic downturn, and a mountain of political mudslinging, if you’re so over 2020 (and we think that includes just about everybody), here’s the perfect sign to bring us all together (Etsy, $5.09).

2. For dog lovers

At least 50% of the neighborhood will agree.

Amazon

Now here’s a yard sign we can really get behind.

When you think about it, dogs have some really great traits that would make them great presidents—they forgive easily, offer unconditional love to those around them, advocate for naps, and don’t take life too seriously.

If you’re an animal lover, you need to let the world know with this humorous sign (Amazon, $24)—and you won’t offend anyone in the process (except maybe cat lovers). And they can always get their own version, shown up top, from Etsy for $37.49).

3. For ‘Star Wars’ fans

Get out your light saber!

Etsy

Even if you haven’t watched a single “Star Wars” movie, you’ve probably heard the quote: “Help me, Obi-Wan Kenobi. You’re my only hope.” (And in case you’re now curious, it’s from “Star Wars: Episode IV—A New Hope,” made in 1977.)

The expression seems fitting this year, especially when you consider all the chaos and turmoil that 2020 has sent our way. Can even Obi-Wan help us now, or are we too far gone?

Fingers crossed. Either way, this cinematic yard sign (Etsy, $16.90) just might make you feel better about our prospects.

4. For people who love to hate Karens

If you think your neighbors can take a joke

Etsy

We apologize to all the real Karens out there (it’s been an extra rough year for you, hasn’t it?), but this one was just too funny not to share.

The name Karen has recently become synonymous with a particular type of woman, typically a white, wealthy (or at least middle-class) woman, who isn’t afraid to exercise her privilege.

She might call the police on you for nabbing the last packet of organic tofu, or for just breathing too loud or standing too close while waiting for your latte at Starbucks. Suffice it to say, if you don’t vote for her, she’s going to need to speak to your manager, just like this sign says (Etsy, $12).

5. For rickrollers

Rick Astley’s a good stand-in.

Etsy

If you’ve never been “rickrolled” before, allow us to explain this joke. You see, there’s this funny prank that started on the internet but later made its way into real life.

To “rickroll” someone, all you have to do is trick someone into watching Rick Astley’s 1987 hit song “Never Gonna Give You Up” (this is usually accomplished by a misleading hyperlink that promises to deliver something else).

You can also pull off the prank by subtly incorporating the lyrics of the song into everyday conversation or by buying this yard sign (Etsy, $8.99). Sure, it might go right over some neighbors’ heads, but the ones who do get it will think you’re hilarious and hip with the times.

6. If you’re sick of presidential elections

At the end of your rope

Amazon

Or perhaps you think the Trump vs. Biden debate misses the bigger point.

If so, this sign (Amazon, $15.99) could help vent your frustrations and send out a clarion call: Is there anyone out there, anywhere, who can help lead us in the right direction?

7. If you wish the world would just end already

A cataclysmic choice

Etsy

Look, surely the world was in much better shape when the asteroid that killed the dinosaurs pummeled the Earth, right?

Somebody call NASA and see if they can work something out.

In the meantime, you can express your utter lack of hope in 2020 with this despairing yard sign (Etsy, $12.60).

8. If you’re sick of all the conspiracy theories

Let’s embrace the counterfactual.

Etsy

Conspiracy theories are rampant right now. So while we’re at it, why not revive the legend of Bigfoot? Stranger things have caught on (Etsy, $12.60).

9. If you’re not sure what to say

Calling anyone out there!

Etsy

You want to take a stand—but aren’t sure what’s worth fighting for anymore—or for whom.

If that sums up your feelings, this sign can help express your utter lack of direction (Etsy, $24).

The post 9 Presidential Lawn Signs That’ll Make You (and Your Neighbors) Laugh appeared first on Real Estate News & Insights | realtor.com®.


via 9 Presidential Lawn Signs That’ll Make You (and Your Neighbors) Laugh