- Shopping around for the best possible mortgage rate matters more for homebuyers with lower credit scores, in general, because there is more variation in the quotes they receive.
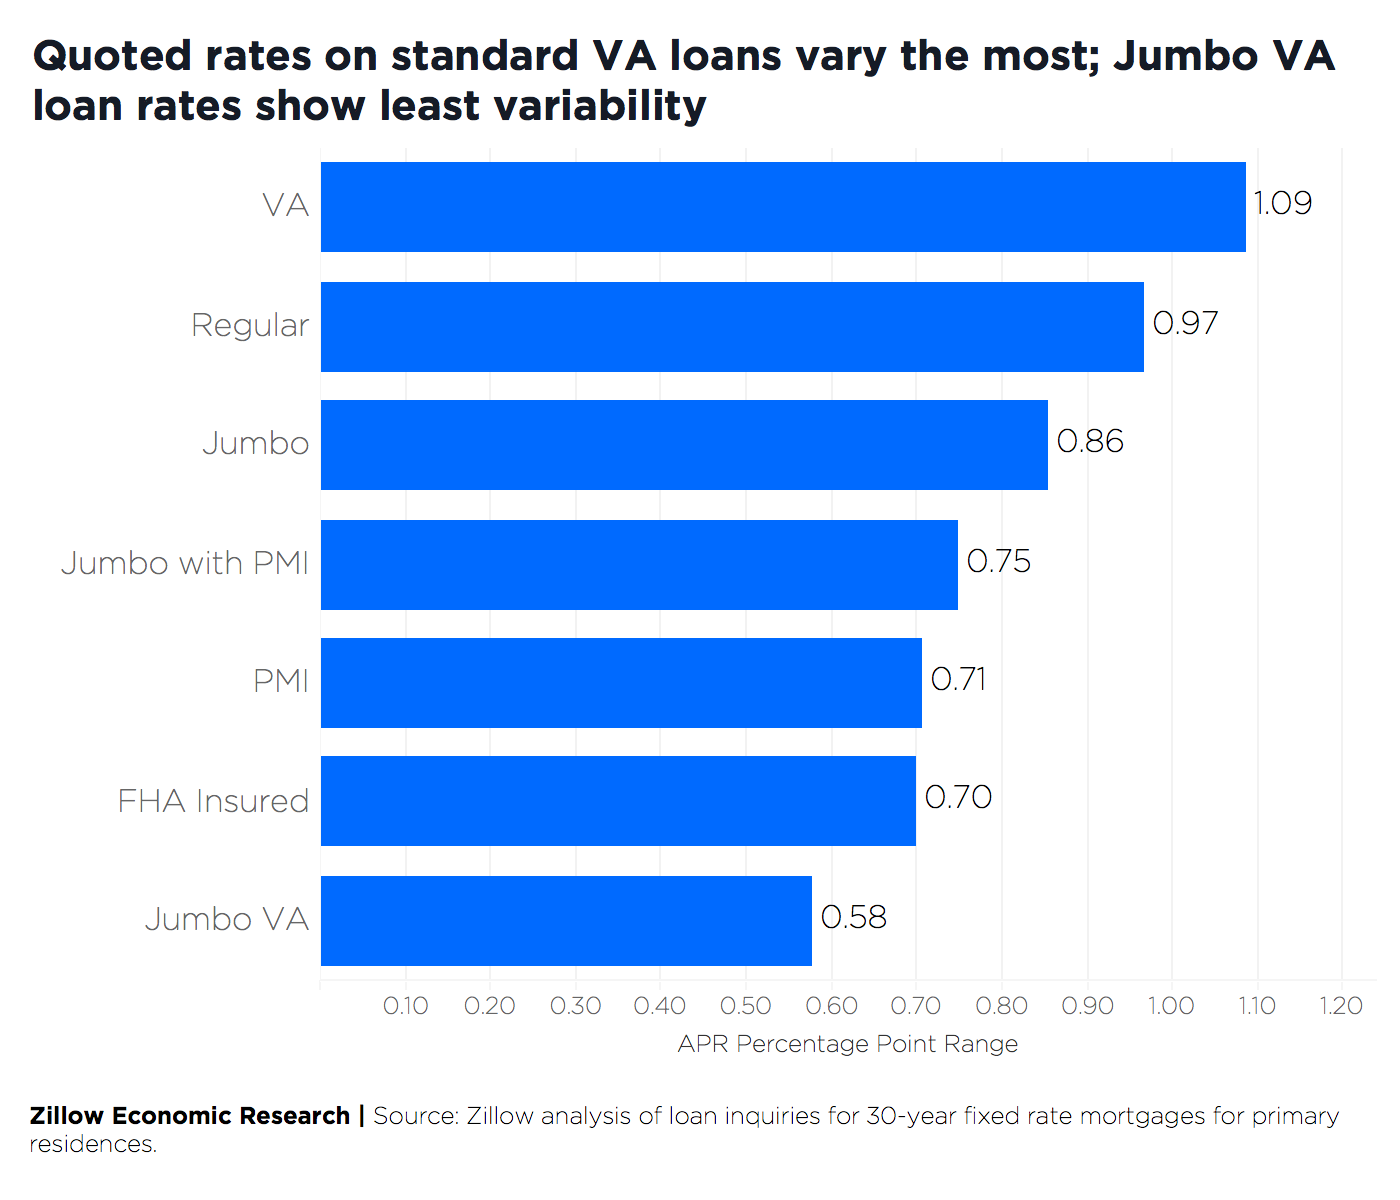
- The median spread for standard (no PMI, jumbo or VA) loans was almost 97 basis points. Rates offered for VA loans, while often among the lowest, have the widest spread between the typical minimum and maximum quote, at 109 basis points. Rates quoted for jumbo VA loans were the most consistent, typically varying by 58 basis points.
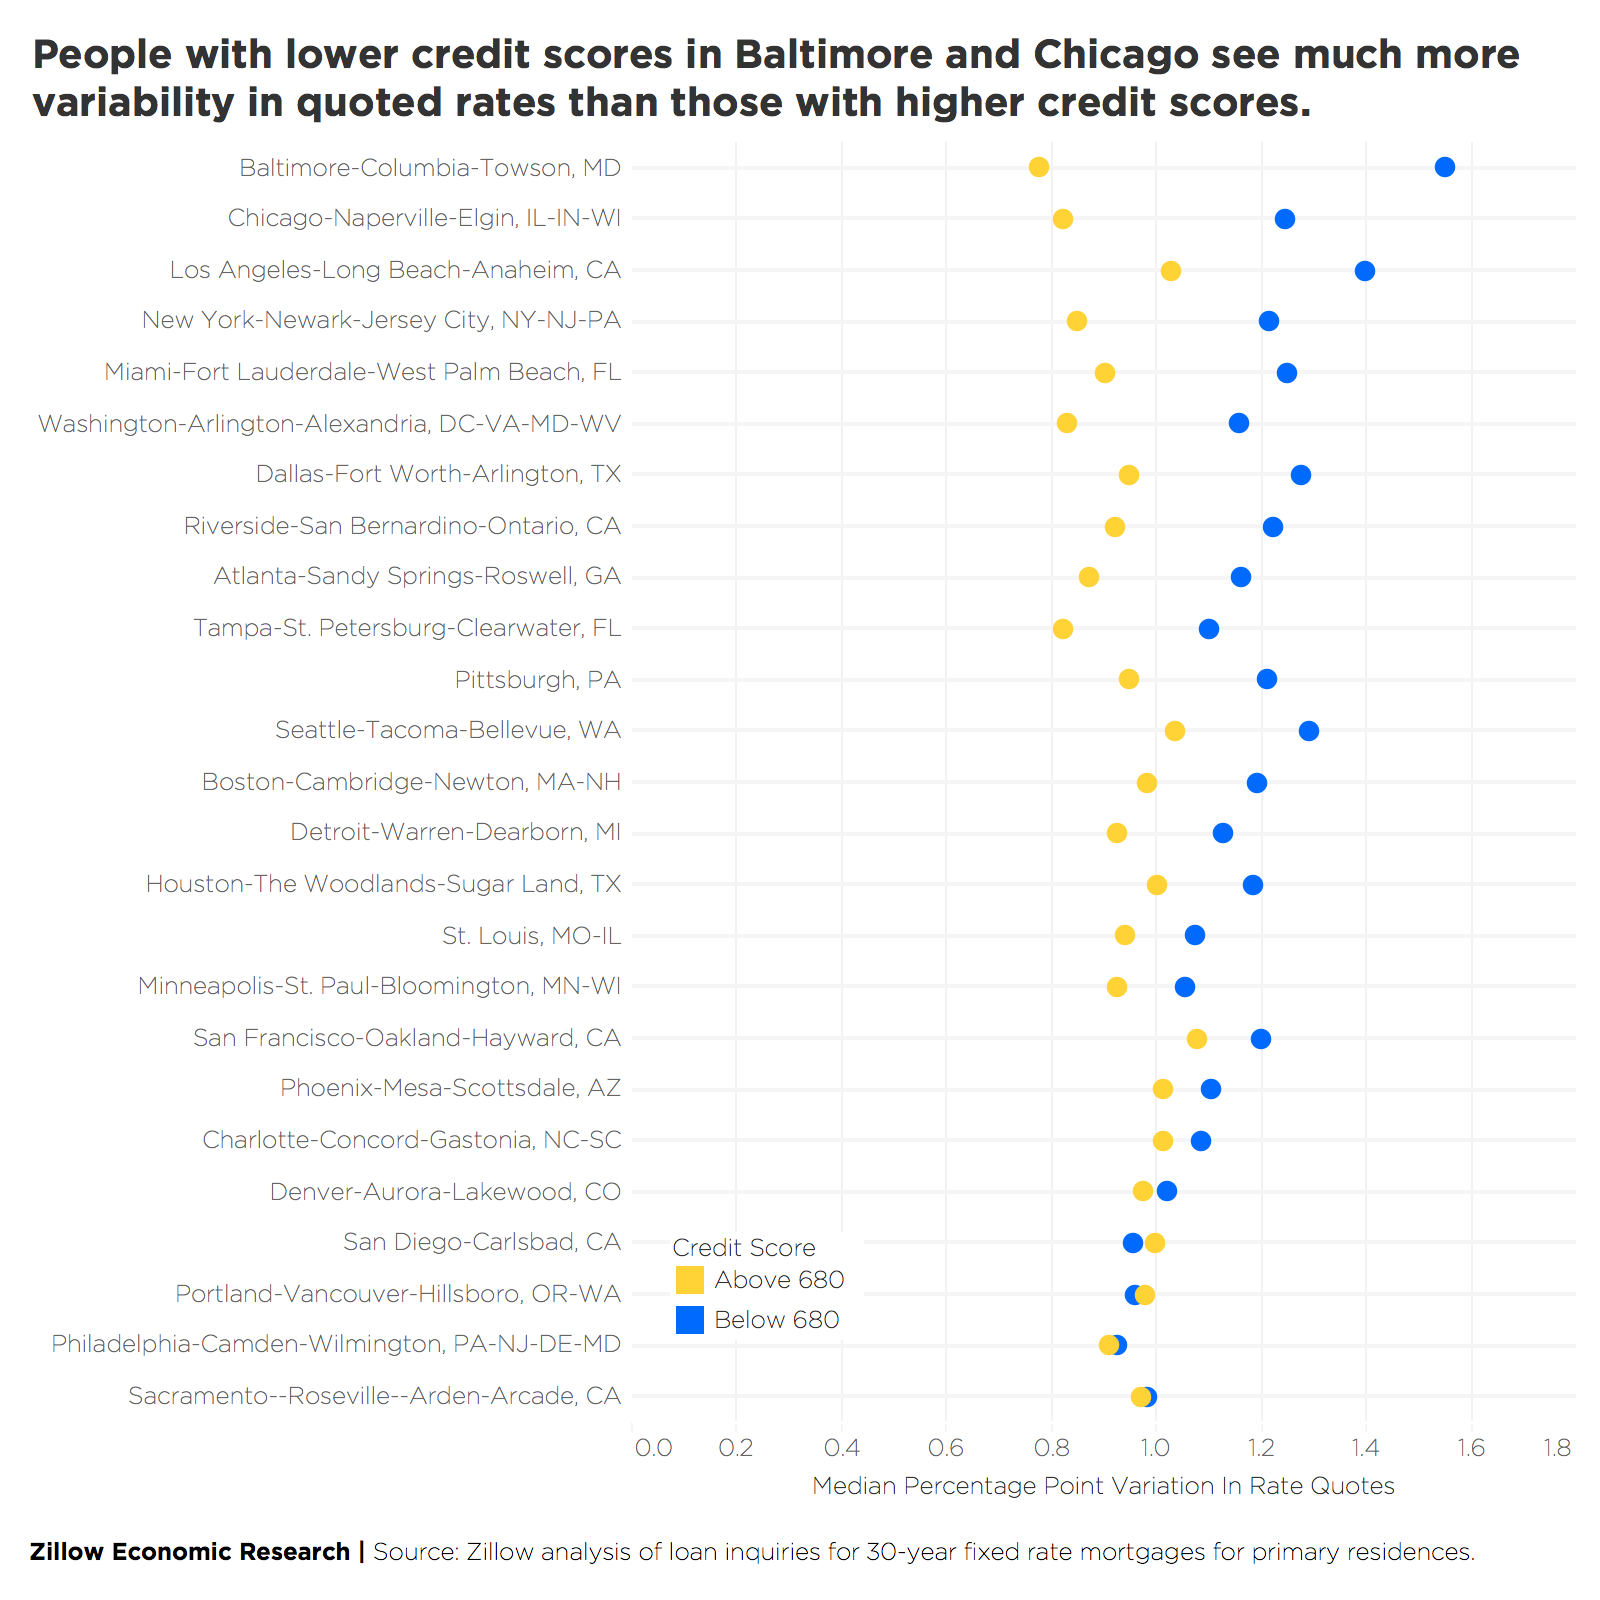
- Pricey west coast cities including San Francisco and Seattle top the list of places where rate variability was the highest, likely driven by a larger share of jumbo loan inquiries.
Especially for borrowers with lower credit scores, it can literally pay to know by how much, where and why mortgage interest rates on different loan products offered to otherwise similar borrowers can often vary dramatically.
The difference between an affordable and burdensome monthly mortgage payment can come down to a few basis points, which can be illustrated with some quick, back-of-the-napkin math. A hypothetical home buyer looking to buy the median-valued U.S. home (about $227,000) with a 20% down payment and a standard, 30-year, fixed-rate mortgage at a 4% annual percentage rate (APR) would pay about $1095/month, including taxes and insurance. Keeping all else the same, but upping the APR by 100 basis points to 5%, the monthly payment increases to $1,203 – an almost 10% bump.
The general rule of thumb says housing costs should not exceed 30% of one's income for it not to be a budgetary burden. Again, using the median U.S. home as an example, a borrower in the same circumstances securing a loan at a 4% APR[1] would need to earn at least $3,650 per month ($43,800/year) in order not to cross the 30% threshold. At a 5% APR, the same borrower would need to earn $4,010 per month ($48,120/year) for their mortgage to remain affordable.
Clearly, it benefits borrowers of all types to explore their options before committing to a loan. But shopping around may have the most benefits for those borrowers with the lowest credit scores, since they're most likely to see the biggest differences between the lowest and highest rates they're offered.
Different Lenders, Different Rates – Especially for Those with Lower Credit Scores
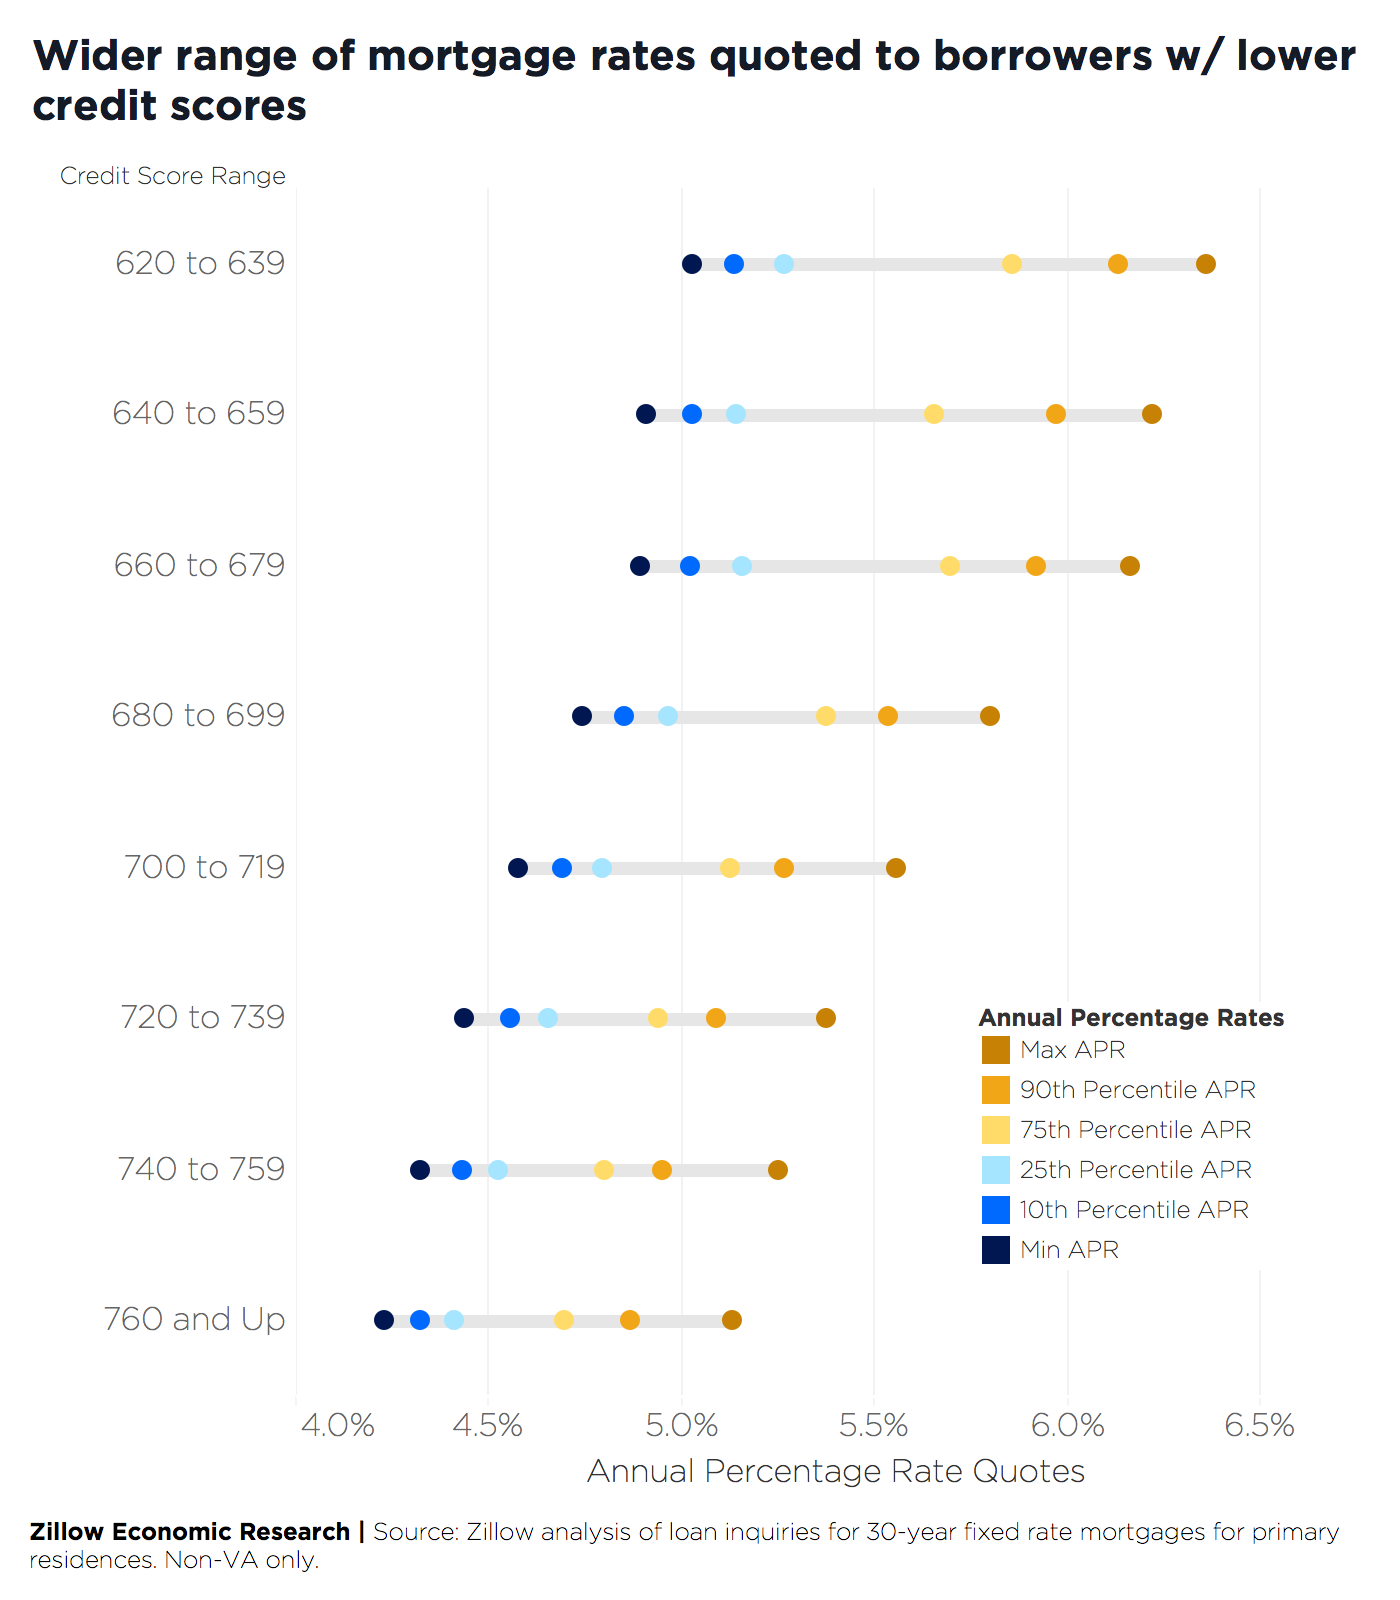
Because they're perceived as riskier, prospective buyers with lower credit scores are generally offered higher interest rates, and ultimately pay higher costs – a way for lenders to offset their risk by getting paid more to take it on. The median APR offered to those with a credit score of 760 or higher (generally regarded as excellent/low-risk) was 4.54%, according to a Trulia analysis of rates offered to borrowers seeking 30-year fixed-rate mortgages between September, 2018, and Mid-May, 2019. For those with a credit score in the 620-to-639 range (the lower range of acceptable scores, considered much riskier), the median rate quoted over the same period was 5.48% — a difference of 94 basis points (or almost 1 full percentage point).
We also found that the spread between the "best" (lowest) and "worst" (highest) APRs offered to borrowers with lower credit scores tended to be much wider. Looking at the median maximum and minimum quote for each inquiry made, the gap between best and worst rates was 92 basis points among those with credit scores above 760. For those with scores in the 620-639 range, there was a 133-basis point gap between best and worst APRs offered.
Under the same assumptions as above, those getting a loan at the higher end of this low-credit APR range would need to earn about $575 more per month than their peers able to secure a loan at the low end in order for their payments to remain affordable (below the 30% of income threshold). Borrowers with excellent credit scores securing a loan offered at the higher end of their scale would only need $280 more in income per month to keep a payment affordable, compared to their high-credit peers offered a rate at the low end.
VA Loans, Jumbo Loans Push Up Rate Variation
In addition to credit score, the type of loan a potential borrower is seeking can also make a big difference in the range of rates they are likely to be offered. The data we looked at showed, at the median, a spread of 97 basis points between the best and worst rates quoted on an otherwise "standard" loan.[2] But non-VA jumbo loans (loans above conforming loan limits) that are not eligible for a federal guarantee, showed less rate volatility. This is very likely because in most places, those that typically apply for jumbo loans also tend to have disproportionately higher credit scores. When controlling for credit score, rates for non-VA jumbo loans look a lot more volatile.
Inquiries for non-jumbo VA loans were generally quoted the lowest overall rates, with a median APR of 4.25%. Non-VA loans of the same type had a median rate quote of 4.5%. But VA loans also seem to vary the most between the typical maximum and minimum quotes offered, with a spread of more than 109 basis points. This variability persists even when controlling for credit score and location.
Pricey Markets, More Fluctuation
Variation in quoted rates can also be wide depending on where a would-be borrower lives. Among the largest 25 metros, regardless of credit score and loan type, the gulf between best and worst rates offered on a 30-year, fixed-rate mortgage was highest in San Francisco, Seattle and Los Angeles – also among the nation's priciest markets. And because homes in these markets are considerably more expensive than in other places, a higher share will require a jumbo loan. Because of this, more inquiries from borrowers with a wider range of credit scores are submitted, pushing up the typical variability of APR quotes.
Looking more closely at these areas, we see that the degree to which mortgage rates vary between high-credit score inquiries and low-credit score inquiries is not constant. In Baltimore, for example, those with high credit scores can expect to see quotes vary by 78 basis points between the best and worst rate. But for those with a credit score below 680, that variation shoots up to 155 basis points.
So, who stands to benefit the most from shopping around for a mortgage? First, those with lower credit scores should expect to see more variability in the quotes they are offered, even when controlling for loan type and location. Controlling for credit score and metro area, those that can take advantage of VA benefits and those looking for a jumbo loan should also make sure they have looked at several options before committing. Finally, outside of the pricey west-coast markets – which likely see more APR volatility because of a high share of jumbo loan inquiries – places including Charlotte, Phoenix, Houston and Boston all have high levels of variability that persists even after controlling for loan type and credit score.
Methodology
To do this analysis, we looked at all mortgage quote inquiries submitted through any Zillow Group quote provider from September 1, 2018 through May 15, 2019. Only quotes for 30-year fixed rate mortgages for purchasing a primary residence were considered. For each inquiry, the minimum, maximum, 10th, 25th, 75th, and 90th percentile APRs were calculated. The median values of those amounts were then taken to come up with the various grouping presented above. Only inquiries that returned at least two quotes were considered when looking at the spread of APRs.
In the discussion of rate variation by loan type, VA loans were excluded from the analysis as including them exaggerated differences between high and low quotes for lower credit inquiries.
For most of the analysis, credit scores were broken out into groupings of 20 with the exception of the highest credit score group (760 and higher). For the metro-level discussion though, in order to have sample sizes that were robust enough, we simply broke inquiries out into the typical good to great range (680 and above) and compared them to those in the fair to poor range.
The model below was used to inform discussions of variation in the APR range by type of loan and geography all else being equal. Coefficients for types of loans are all relative to the variability of an FHA loan with PMI. Coefficients for metro areas are all relative to the variability in Atlanta.
| Dependent variable: | |
| APR Quote Percentage Point Range
(Multiplied by 1000) |
|
| Credit Score | -1.199*** |
| (0.032) | |
| Jumbo Loan | 212.698*** |
| (5.102) | |
| Jumbo Loan with PMI | 334.593*** |
| (9.934) | |
| Jumbo Loan VA | -266.777*** |
| (44.258) | |
| PMI | -94.219*** |
| (4.667) | |
| Regular (No PMI, VA, Jumbo) | 94.160*** |
| (4.487) | |
| VA | 316.184*** |
| (4.787) | |
| Baltimore-Columbia-Towson, MD | -23.156** |
| (9.605) | |
| Boston-Cambridge-Newton, MA-NH | 97.462*** |
| (8.199) | |
| Charlotte-Concord-Gastonia, NC-SC | 102.912*** |
| (8.134) | |
| Chicago-Naperville-Elgin, IL-IN-WI | -32.281*** |
| (8.100) | |
| Dallas-Fort Worth-Arlington, TX | 10.563 |
| (6.520) | |
| Denver-Aurora-Lakewood, CO | -16.633** |
| (7.473) | |
| Detroit-Warren-Dearborn, MI | -8.147 |
| (9.530) | |
| Houston-The Woodlands-Sugar Land, TX | 42.705*** |
| (7.510) | |
| Los Angeles-Long Beach-Anaheim, CA | 35.760*** |
| (5.772) | |
| Miami-Fort Lauderdale-West Palm Beach, FL | 64.745*** |
| (6.881) | |
| Minneapolis-St. Paul-Bloomington, MN-WI | -8.315 |
| (9.562) | |
| New York-Newark-Jersey City, NY-NJ-PA | -52.509*** |
| (6.102) | |
| Philadelphia-Camden-Wilmington, PA-NJ-DE-MD | 8.592 |
| (8.043) | |
| Phoenix-Mesa-Scottsdale, AZ | 69.732*** |
| (7.349) | |
| Pittsburgh, PA | 58.098*** |
| (13.543) | |
| Portland-Vancouver-Hillsboro, OR-WA | 6.473 |
| (8.769) | |
| Riverside-San Bernardino-Ontario, CA | -32.937*** |
| (7.770) | |
| Sacramento–Roseville–Arden-Arcade, CA | -8.236 |
| (8.873) | |
| San Diego-Carlsbad, CA | 36.564*** |
| (6.820) | |
| San Francisco-Oakland-Hayward, CA | 54.354*** |
| (6.705) | |
| Seattle-Tacoma-Bellevue, WA | 58.710*** |
| (6.668) | |
| St. Louis, MO-IL | -18.858* |
| (10.334) | |
| Tampa-St. Petersburg-Clearwater, FL | 28.311*** |
| (8.071) | |
| Washington-Arlington-Alexandria, DC-VA-MD-WV | -26.310*** |
| (6.159) | |
| Constant | 1,785.789*** |
| (23.580) | |
| Observations | 99,826 |
| R2 | 0.183 |
| Adjusted R2 | 0.182 |
| Residual Std. Error | 1,520.955 (df = 99794) |
| F Statistic | 719.186*** (df = 31; 99794) |
| Note: | *p<0.1; **p<0.05; ***p<0.01 |
[1] APR, or annual percentage rate, is the cost (interest rate) of borrowing the principal loan amount plus other costs, such as broker fees, discount points, and some closing costs and is the best representation of how much a monthly mortgage payment will cost.
[2] We determine a standard loan as one not requiring private mortgage insurance (PMI) or FHA insurance; one that is below the local threshold for a "jumbo" loan; and a loan not originated or backed by the department of Veterans Affairs.
The post For Some, it Literally Pays to Shop Around for A Mortgage appeared first on Zillow Research.
via For Some, it Literally Pays to Shop Around for A Mortgage

No comments:
Post a Comment